Choosing the Right Sample Size for Accurate Results
Learn how to calculate the ideal sample size needed for your survey or experiment using step-by-step examples and formulas. Perfect for means or proportions.
🎯 Goal: Calculate Minimum Sample Size for Reliable Statistics
You don’t need to collect data from everyone to get meaningful results. By defining how accurate and confident you want to be, you can compute a precise sample size using just a few inputs.
This lets you avoid:
- Wasting time and money on too many participants 💸
- Getting unreliable results from too few participants 📉
📚 This post is part of the "Intro to Calculus" series
🔙 Previously: Confidence Levels Explained: 90%, 95%, and 99% Confidence Intervals
🔜 Next: Confidence Intervals: A Full Case Study on Mean vs Proportion
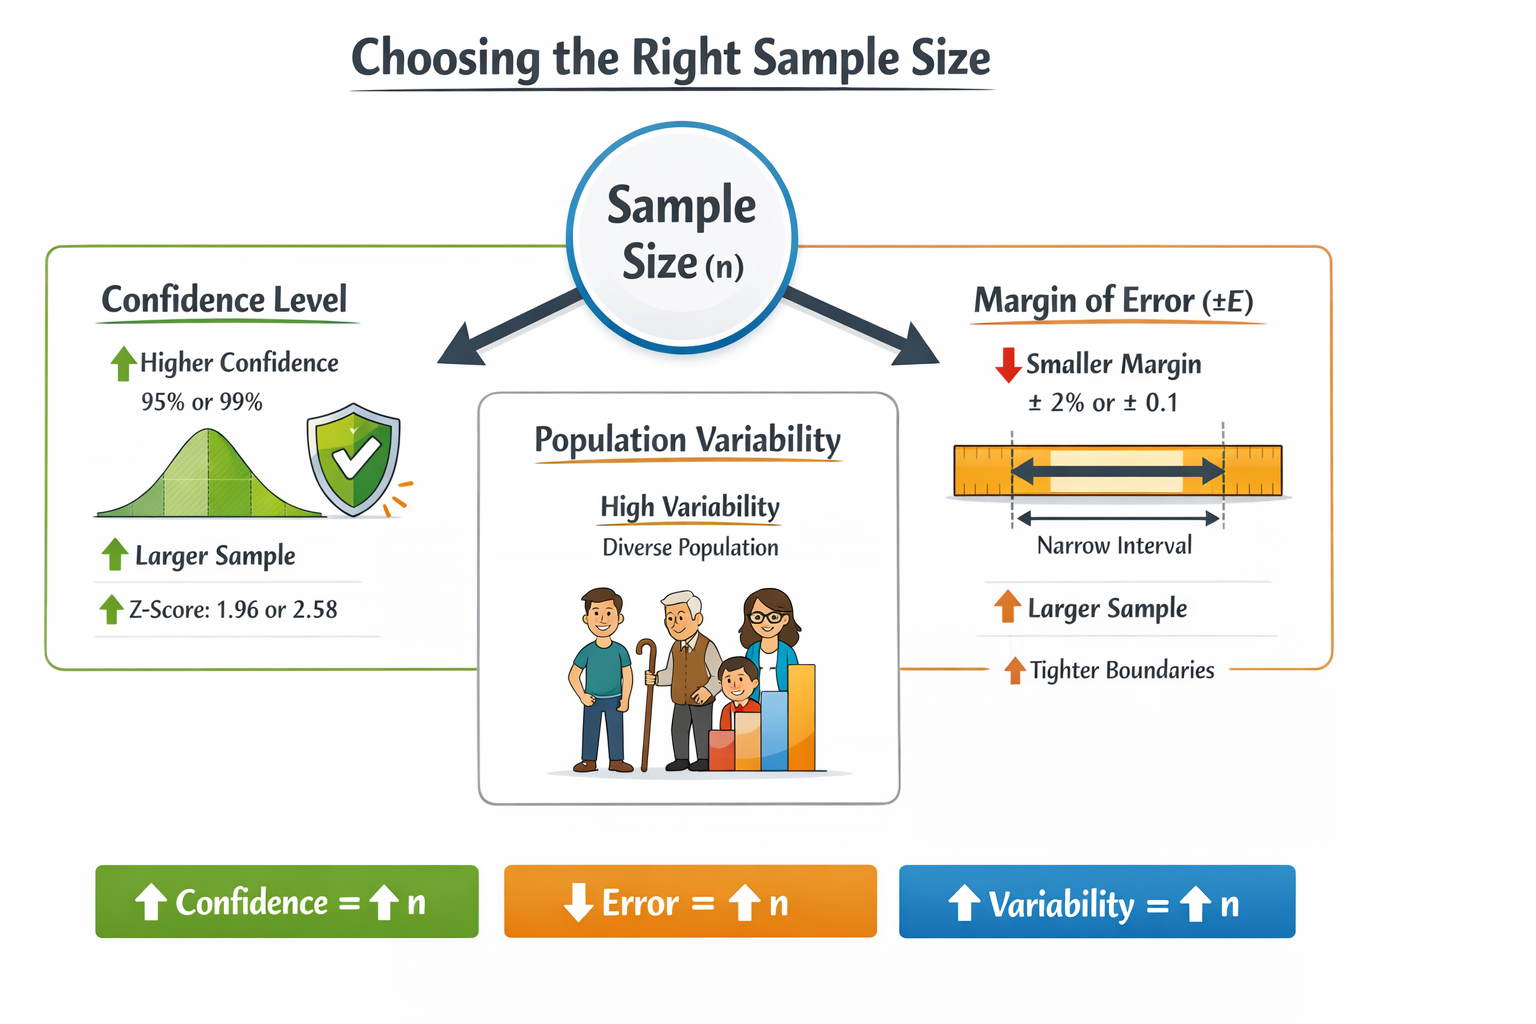
🔑 The 3 Key Drivers of Sample Size
To compute the needed sample size \( n \), you must define these 3 factors:
| Factor | Description | Effect on Sample Size |
|---|---|---|
| Margin of Error (E) | How precise your results need to be | Smaller error = Larger sample |
| Confidence Level | How sure you want to be (e.g., 95%) | Higher confidence = Larger sample |
| Population Variability | How much variation exists (SD or proportion) | More variation = Larger sample |
☕ Case Study 1: Estimating a Mean (Numerical Average)
Scenario: You want to estimate how many hours per week freelancers in Berlin spend in meetings.
Inputs:
- Confidence Level: 95% → Z-score = 1.96
- Desired Margin of Error (\( E \)): ±0.5 hours
- No known standard deviation, but you estimate the range is from 0 to 8 hours/week
\[ \sigma \approx \frac{\text{Range}}{4} = \frac{8}{4} = 2 \]
Formula for Mean:
\[ n = \frac{Z^2 \cdot \sigma^2}{E^2} \]
Plug-in:
\[ n = \frac{(1.96^2 \cdot 2^2)}{0.5^2} = \frac{(3.8416 \cdot 4)}{0.25} = \frac{15.3664}{0.25} = 61.47 \]
✅ Result: You need at least 62 freelancers.
📊 Case Study 2: Estimating a Proportion (Yes/No Data)
Scenario: You want to estimate what percentage of people in Tokyo recycle regularly, and you have no prior estimate.
Inputs:
- Confidence Level: 99% → Z-score = 2.58
- Margin of Error: ±8% → \( E = 0.08 \)
- No prior data → use \( p = 0.5 \) (safest assumption)
Formula for Proportion:
\[ n = \frac{p(1-p) \cdot Z^2}{E^2} \]
\[ n = \frac{(0.5 \cdot 0.5 \cdot 2.58^2)}{0.08^2} = \frac{(0.25 \cdot 6.6564)}{0.0064} \approx 260.6 \]
✅ Result: You need at least 261 participants.
🐍 Python in Practice: Sample Size Calculations
1
2
3
4
5
6
7
8
9
10
11
12
13
14
15
import numpy as np

# For estimating a mean
Z_mean = 1.96  # 95% confidence
sigma = 2      # estimated SD from range
E_mean = 0.5   # margin of error
n_mean = (Z_mean**2 * sigma**2) / (E_mean**2)
print(f"Sample size for mean: {np.ceil(n_mean)}")

# For estimating a proportion
Z_prop = 2.58  # 99% confidence
E_prop = 0.08  # margin of error
p = 0.5        # safest guess
n_prop = (p * (1 - p) * Z_prop**2) / (E_prop**2)
print(f"Sample size for proportion: {np.ceil(n_prop)}")
Output:
- Sample size for mean: 62.0.
- Sample size for proportion: 261.0.
🧠 Practical Plan: How to Choose Your Sample Size
✅ Step 1: Set Your Standards
- Confidence Level: 95% (Z = 1.96) or 99% (Z = 2.58)
- Margin of Error: How accurate must your result be? ±5% or ±0.5 units?
✅ Step 2: Estimate Variability
- For Means: Use the formula \( \text{Range} / 4 \) if you don’t know SD
- For Proportions: Use 0.5 if you have no idea — it gives the safest (largest) estimate
✅ Step 3: Plug Into Formula
For Means: \[ n = \left(\frac{Z \cdot \sigma}{E}\right)^2 \]
For Proportions: \[ n = \left(\frac{Z}{E}\right)^2 \cdot 0.25 \]
✅ Best Practices for Sample Size Calculation
- 📊 Use 95% confidence level unless you have a high-risk case requiring 99%
- 📏 Choose an appropriate margin of error — tighter estimates require more data
- 🔍 Always round sample size up to ensure minimum requirements are met
- 📚 Use past studies or estimated ranges to guess standard deviation when needed
- 🧠 If no prior percentage is known, assume 50% for safest sample size
⚠ Common Pitfalls
- 🚫 Underestimating sample size by using too loose a margin of error or confidence level
- 😬 Not accounting for variability — forgetting to estimate standard deviation or using wrong value
- 📉 Using the sample size formula for means on binary data (and vice versa)
- 🔁 Forgetting to round up — rounding down leads to underpowered studies
- 🧾 Skipping documentation — always note your assumptions (SD, p, E, Z)
🧠 Level Up: Advanced Sampling Insights
- 🎯 Consider effect size when comparing two groups — smaller differences require larger samples
- 🧮 Use pilot studies to estimate standard deviation more accurately
- 📈 Don’t forget power analysis — plan for 80–90% power in hypothesis testing
- ⚙️ Use online calculators or software (like G*Power) for complex designs
Understanding advanced drivers of sample size boosts your statistical confidence and helps prevent wasted effort.
🤖 Why This Matters for Machine Learning
- 📈 Model Evaluation: Ensure test sets are large enough to evaluate model performance reliably
- 🔄 A/B Testing: Avoid false positives or false negatives by planning sample sizes ahead of experiments
- 🧪 Labeling Strategies: When manually labeling data, use sample size planning to reduce workload while maintaining accuracy
- 🔍 Survey-based Features: Plan how many user feedback responses you need for trustworthy features or preferences
Knowing how many samples to collect improves the efficiency, accuracy, and fairness of your ML workflow — from training to testing to deployment.
📌 Try It Yourself: Sample Size Quiz
Q1: What happens to required sample size if you want more precision (smaller margin of error)?
💡 Show Answer
Sample size increases.Q2: What Z-score is used for 99% confidence?
💡 Show Answer
2.58Q3: If you don’t know the proportion for a yes/no question, what value should you use for p?
💡 Show Answer
Use 0.5 (50%) — it's the most conservative assumption.Q4: Why should you always round your sample size up?
💡 Show Answer
To ensure you meet the minimum needed to maintain accuracy.✅ Step 4: Round Up
Always round up your result. If your calculation returns 261.1, round up to 262 — that’s your minimum required sample size .
🔜 What’s Next?
In the next post, we’ll dive into Finite Population Correction — how to adjust your sample size when you’re working with small or known populations.
📺 Explore the Channel

🎥 Hoda Osama AI
Learn statistics and machine learning concepts step by step with visuals and real examples.
💬 Got a Question?
Leave a comment or open an issue on GitHub — I love connecting with other learners and builders. 🔁