Confidence Interval for an Unknown Population Standard Deviation
Learn how to construct a confidence interval for a population mean when the standard deviation is unknown using the t-distribution.
🎯 Goal: Estimating a Population Mean with Unknown Standard Deviation
When we don’t know the population standard deviation (\( \sigma \)), we rely on the sample standard deviation (\( s \)) instead.
In such cases, we use the t-distribution, not the Z-distribution.
📚 This post is part of the "Intro to Calculus" series
🔙 Previously: Confidence Interval for a Known Population Standard Deviation
🔜 Next: Confidence Interval for a Population Proportion — Step-by-Step Guide
☕ Real-World Case: Coffee Consumption Among Remote Workers
Imagine you’re studying how much coffee remote developers drink daily. You gather data from a random sample of 25 developers and calculate:
- Sample Mean: \( \bar{x} = 3.8 \) cups/day
- Sample Standard Deviation: \( s = 1.1 \) cups
- Sample Size: \( n = 25 \)
- Confidence Level: 95% (t-critical value for \( df = 24 \) is \( t_{0.025} \approx 2.064 \))
📊 Step-by-Step: Building the Confidence Interval (T-Distribution)
🔹 Step 1: Calculate the Standard Error
\[ SE = \frac{s}{\sqrt{n}} = \frac{1.1}{\sqrt{25}} = 0.22 \]
🔹 Step 2: Find the Margin of Error
\[ ME = t \times SE = 2.064 \times 0.22 \approx 0.454 \]
🔹 Step 3: Construct the Confidence Interval
\[ \bar{x} \pm ME = 3.8 \pm 0.454 \]
- Lower Bound: \( 3.8 - 0.454 = 3.35 \)
- Upper Bound: \( 3.8 + 0.454 = 4.25 \)
✅ Conclusion: We are 95% confident that average coffee consumption among remote developers is between 3.35 and 4.25 cups/day.
🧠 Visual Insight: Why Use the T-Distribution?
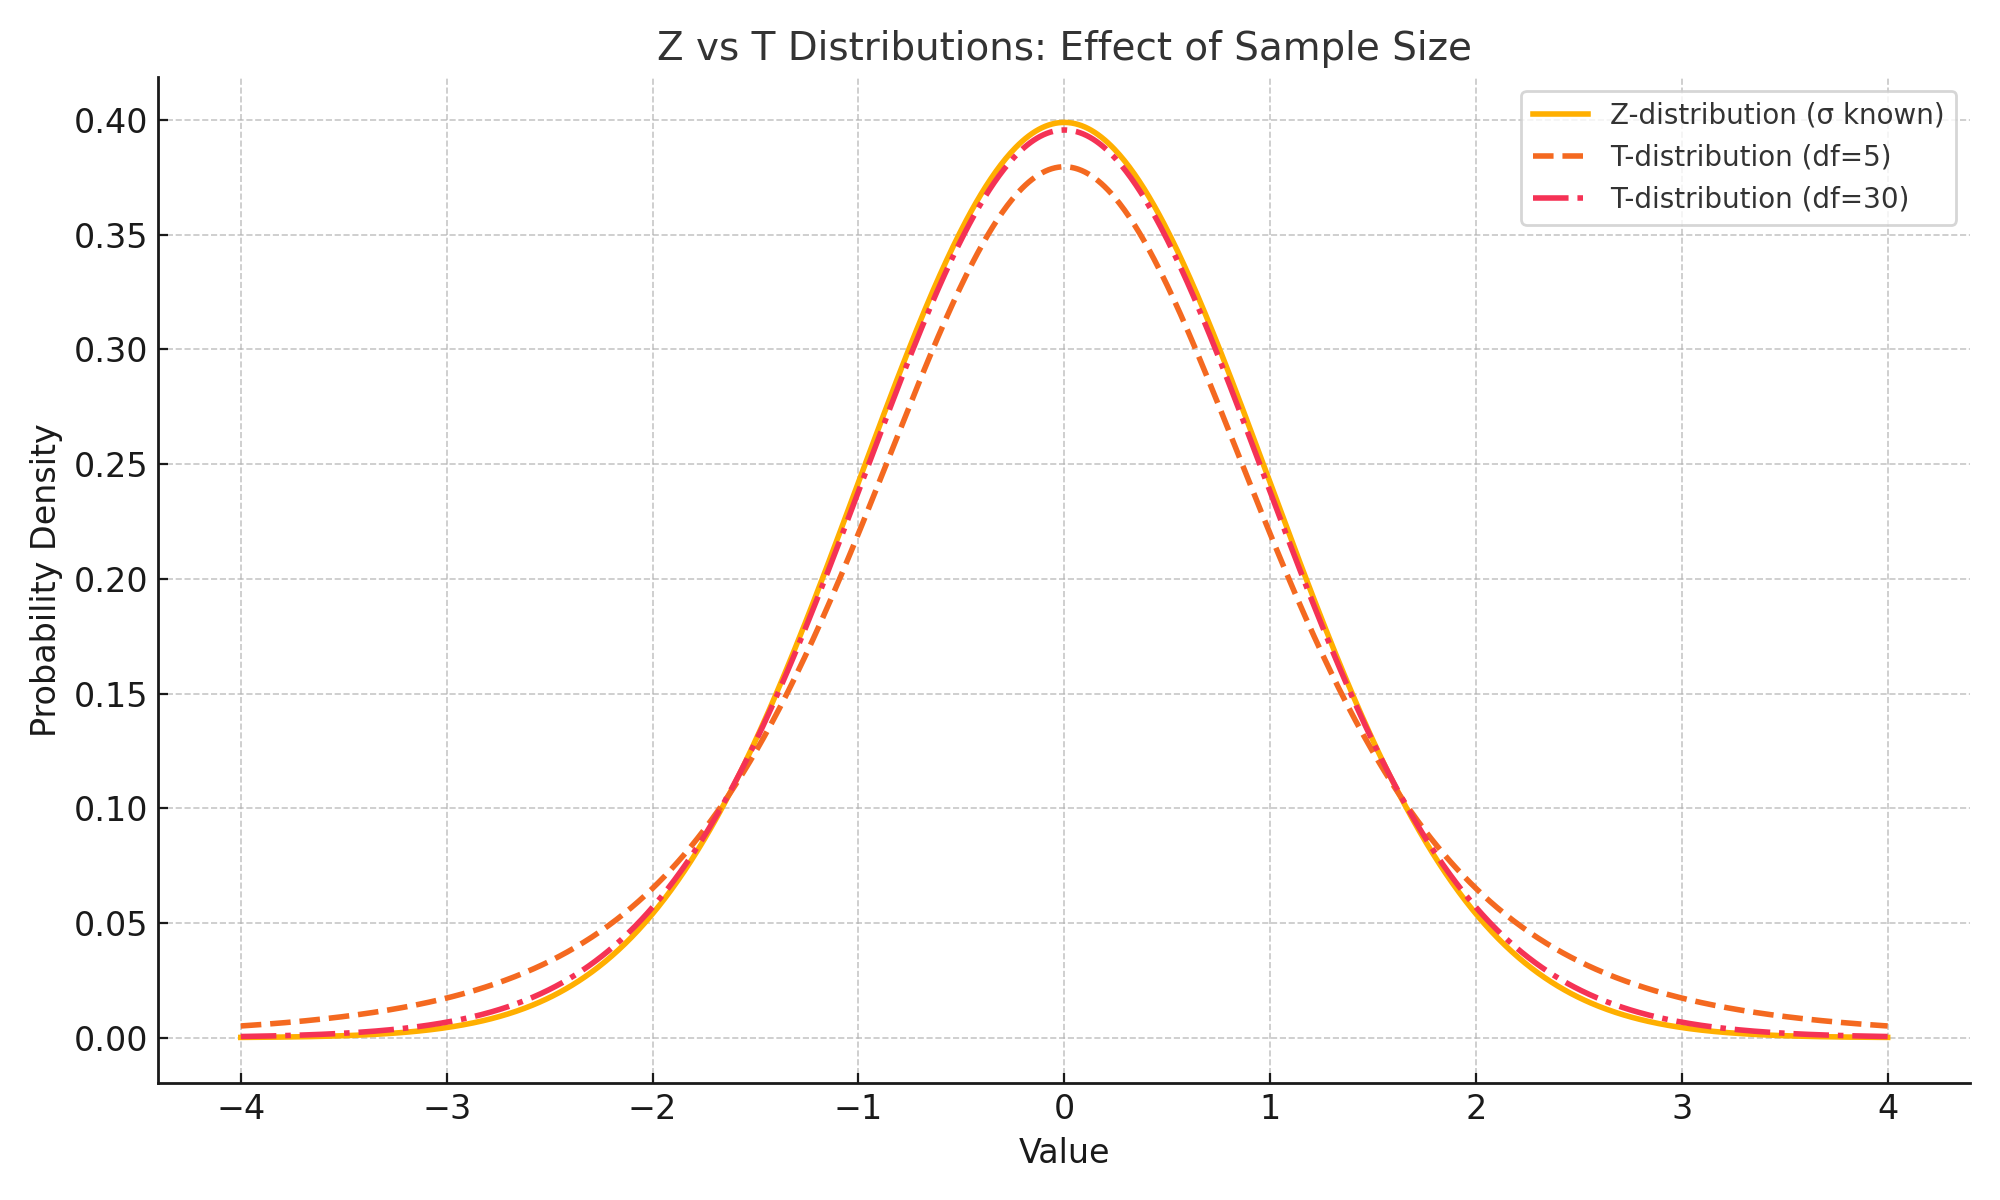
When sample sizes are small, the T-distribution is wider than the Z-distribution — reflecting greater uncertainty.
As sample size increases (and degrees of freedom rise), the T-distribution converges toward the Z-distribution.
This is why we use T when σ is unknown and rely on sample SD.
🧠 Level Up: Why This Matters for Machine Learning
In ML, your data is often a sample from a larger unknown population.
- ⚖️ When model performance varies across subgroups, you need confidence intervals to quantify uncertainty.
- 🧪 In A/B testing or model benchmarking, if the standard deviation is unknown, the T-distribution helps you generalize correctly from sample data.
📈 Understanding this concept sharpens your ability to evaluate models statistically — especially in cases where your dataset is small or imbalanced.
🧠 Why These Formulas Work: Intuition Behind SE and T
The formula for standard error:
[ \(SE = \frac{s}{\sqrt{n}}\) ]
tells us how much the sample mean is expected to vary from one random sample to another.
- Dividing by \( \sqrt{n} \) reflects the idea that larger samples are more stable.
- As \( n \) increases, your sample mean gets closer to the true mean — which shrinks the SE and narrows the confidence interval.
The t-critical value accounts for extra uncertainty when we don’t know the population standard deviation (\( \sigma \)).
- With small samples (low degrees of freedom), the T-distribution is wider than the Z-distribution.
- That’s why the margin of error is larger — it’s protecting you from overconfidence when data is scarce.
🧠 In essence, this math adjusts for the fact that your estimate is shakier when you have less data or less certainty.
🐍 Python in Practice: CI with Unknown Standard Deviation (T-Distribution)
1
2
3
4
5
6
7
8
9
10
11
12
13
14
15
16
17
18
19
20
21
22
import numpy as np
import scipy.stats as stats

# Given
sample_mean = 3.8
sample_std = 1.1
n = 25
df = n - 1
t_critical = stats.t.ppf(1 - 0.025, df)

# Standard Error
se = sample_std / np.sqrt(n)

# Margin of Error
me = t_critical * se

# Confidence Interval
ci_lower = sample_mean - me
ci_upper = sample_mean + me

print(f"95% CI: ({ci_lower:.2f}, {ci_upper:.2f})")
📏 Quick Reference: Steps to Calculate
| Component | Formula | Value |
|---|---|---|
| Sample Mean (\( \bar{x} \)) | — | 3.8 cups |
| Sample SD (\( s \)) | — | 1.1 cups |
| Sample Size (\( n \)) | — | 25 |
| Degrees of Freedom | \( n - 1 \) | 24 |
| t-critical (95%) | \( t_{0.025,24} \approx 2.064 \) | — |
| Standard Error | \( \frac{s}{\sqrt{n}} \) | 0.22 |
| Margin of Error | \( t \times SE \) | 0.454 |
| CI | \( \bar{x} \pm ME \) | (3.35, 4.25) |
✅ Best Practices for T-Based Confidence Intervals
- 📚 Always use the T-distribution when \[ (\sigma) \] is unknown
- 📈 Report degrees of freedom (n − 1) for transparency
- 👥 Use sufficiently large samples (n > 30) to better approximate normality
- 📉 Check data symmetry — the T-distribution assumes the sample is roughly normal
- 🧾 Always report both the point estimate and the confidence interval range
⚠ Common Pitfalls
- 🚫 Using the Z-distribution when σ is unknown
- 🔁 Forgetting degrees of freedom when looking up critical t-values
- 😬 Assuming small samples are normally distributed without checking
- 📉 Ignoring skewness or outliers — the T-distribution is sensitive when n is small
- 🤔 Confusing confidence intervals with probability — CI reflects method reliability, not certainty about a single estimate
🧠 Level Up: When to Switch from T to Z
- Use the Z-distribution when:
- Population standard deviation (σ) is known
- Sample size is large (n > 30) and the Central Limit Theorem applies
- Use the T-distribution when:
- σ is unknown and estimated using the sample standard deviation
- You are working with small samples (n < 30)
In practice: You will almost always use the T-distribution — Z is a special theoretical case.
📌 Try It Yourself: T-Interval Confidence Quiz
Q1: When should you use the T-distribution instead of Z?
💡 Show Answer
When the population standard deviation is **unknown**.Q2: What’s the standard error formula when using sample SD?
💡 Show Answer
\[ ( SE = \\frac{s}{\\sqrt{n}} \\) \]Q3: Why is “degrees of freedom” used in the t-distribution?
💡 Show Answer
Because we estimate the variance from the sample, so we lose 1 degree of freedom.Q4: Does increasing the sample size reduce the margin of error?
💡 Show Answer
Yes — increasing \[ ( n ) \] reduces SE, which tightens the confidence interval.🔜 What’s Next?
In the next post, we’ll explore how to compare two population means using two-sample T-tests — crucial for A/B testing and hypothesis evaluation in machine learning.
📺 Explore the Channel

🎥 Hoda Osama AI
Learn statistics and machine learning concepts step by step with visuals and real examples.
💬 Got a Question?
Leave a comment or open an issue on GitHub — I love connecting with other learners and builders. 🔁