Confidence Intervals: A Full Case Study on Mean vs Proportion
Learn to calculate confidence intervals using two fresh examples — one for estimating an average (mean) and one for estimating a percentage (proportion) in real-world data science scenarios.
🎓 Two Case Studies: Estimating Means and Proportions in Data Science Student
In this comprehensive example, you’ll learn how to calculate confidence intervals for two different goals:
- Estimating a population average (mean) using the T-distribution
- Estimating a population proportion using the Z-distribution
📌 Scenario A: Estimating an Average (Mean)
🎯 Goal:
Estimate the average number of hours Data Science students spend watching online courses weekly.
📊 Data:
- Sample Size (\( n \)) = 120 students
- Sample Mean (\( \bar{x} \)) = 12.5 hours
- Sample Standard Deviation (\( S \)) = 4.2 hours
- Confidence Level = 95%
🧮 Step-by-Step:
1. Use T-Distribution (since we’re estimating a mean and \( \sigma \) is unknown)
2. Degrees of Freedom: \[ df = n - 1 = 119 \]
3. T-score for 95% confidence and df = 100 (close to 119):
\[ t = 1.984 \]
4. Margin of Error (ME): \[ ME = 1.984 \times \frac{4.2}{\sqrt{120}} \approx 0.76 \]
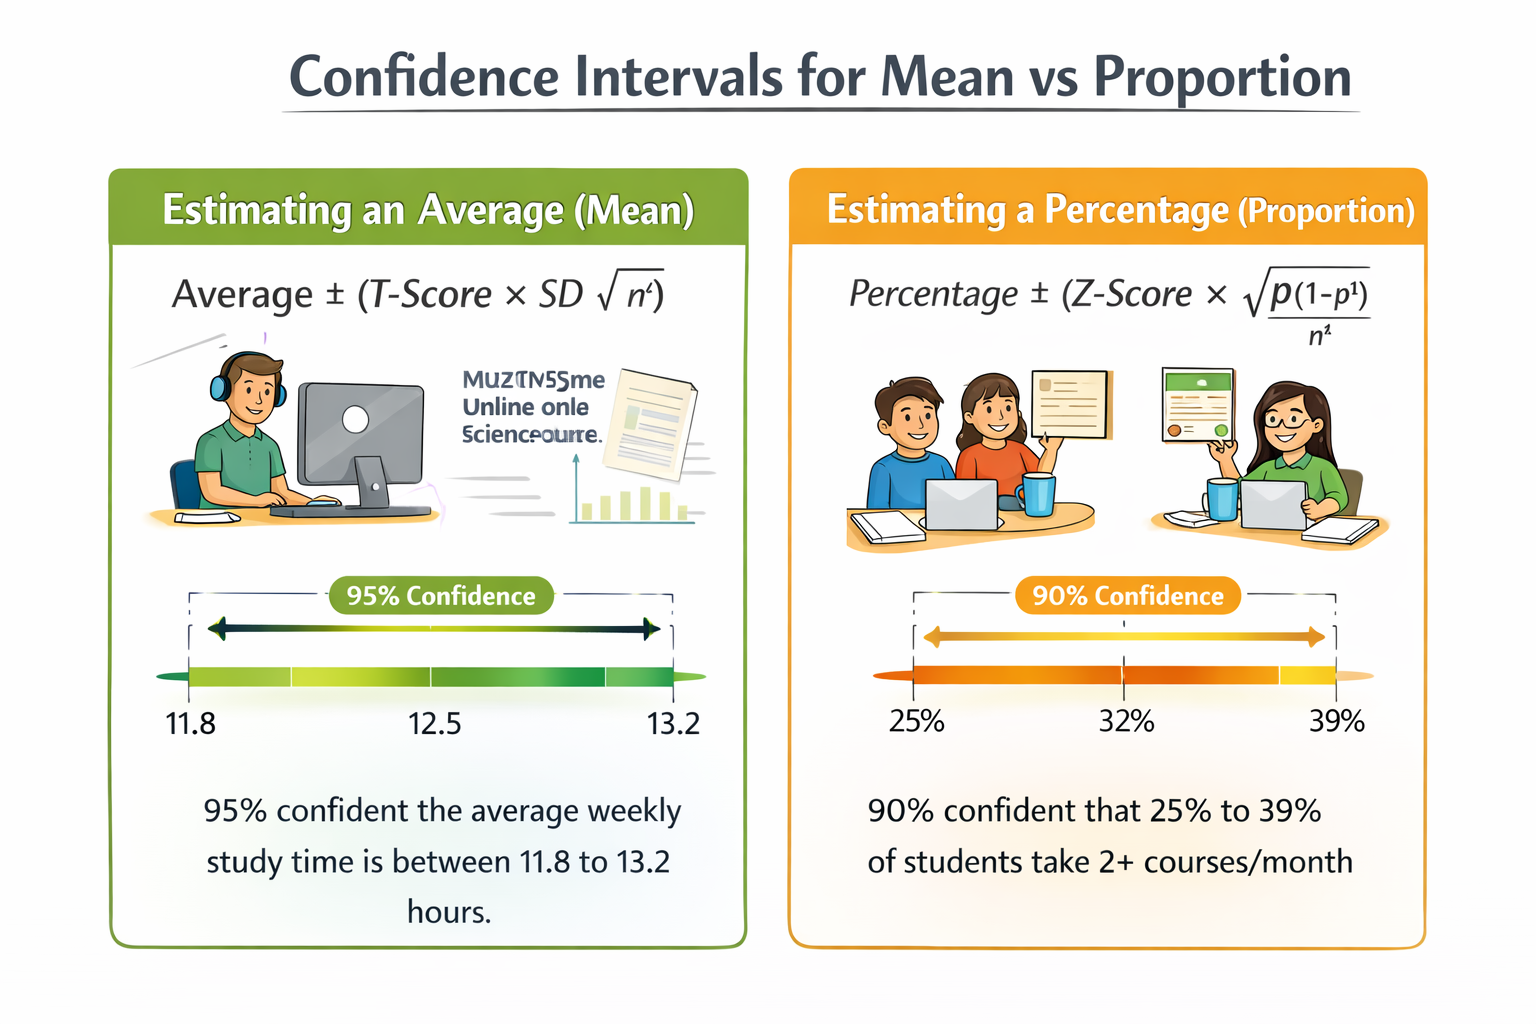
5. Confidence Interval: \[ 12.5 \pm 0.76 \Rightarrow [11.74, 13.26] \]
✅ Conclusion: We are 95% confident that the average number of hours Data Science students spend on online learning weekly is between 11.74 and 13.26 hours.
📌 Scenario B: Estimating a Proportion
🎯 Goal:
Estimate the percentage of Data Science students who complete more than one course per month.
📊 Data:
- Sample Size (\( n \)) = 120 students
- Sample Proportion (\( \hat{p} \)) = 0.32 (32%)
- Confidence Level = 90%
🧮 Step-by-Step:
1. Use Z-Distribution (proportions always use Z)
2. Z-score for 90% confidence: \[ z = 1.645 \]
3. Standard Error (SE): \[ SE = \sqrt{\frac{0.32 \cdot 0.68}{120}} \approx 0.043 \]
4. Margin of Error (ME): \[ ME = 1.645 \times 0.043 \approx 0.071 \]
5. Confidence Interval: \[ 0.32 \pm 0.071 \Rightarrow [0.249, 0.391] \]
✅ Conclusion: We are 90% confident that between 24.9% and 39.1% of Data Science students complete more than one course per month.
🧭 Practical Plan: Choosing the Right Method
Follow this plan anytime you have data and want to estimate population parameters confidently.
✅ Step 1: Define Your Objective
| Type of Measurement | Go To Step |
|---|---|
| Average (Mean) | Step 2A |
| Percentage | Step 2B |
📏 Step 2A: Estimating a Mean
Use the formula:
\[ \text{Mean} \pm \left( \text{T-Score} \times \frac{S}{\sqrt{n}} \right) \]
- Use \( df = n - 1 \) to get your T-score
- Works best when \( \sigma \) is unknown (almost always in real-world data)
📊 Step 2B: Estimating a Proportion
Use the formula:
\[ \text{Proportion} \pm \left( Z \times \sqrt{\frac{p(1-p)}{n}} \right) \]
- Use Z-scores for your confidence level:
- 90% → 1.645
- 95% → 1.96
- 99% → 2.58
🧾 Step 3: Communicate the Results
“We are [Confidence Level]% confident that the true [average/percentage] lies between [lower bound] and [upper bound], based on a sample of [n] participants.”
✅ Best Practices for Confidence Intervals
- 🎯 Use the T-distribution when estimating means with unknown population standard deviation (which is almost always the case)
- 📐 Use the Z-distribution for proportions since it relies on known sample proportions and large enough n
- 🧪 Ensure sample size is large enough: at least 30 for means, and both np and n(1-p) ≥ 15 for proportions
- 📈 Always report both the point estimate and the confidence interval for clarity
- 🔍 State your confidence level clearly in conclusions: “We are 95% confident that…”
⚠ Common Pitfalls
- 🚫 Using Z-distribution for means when population standard deviation is unknown
- 😵💫 Misinterpreting confidence intervals — it’s about method reliability, not a specific probability
- 📉 Failing to check assumptions (normality for small n, np ≥ 15 rule for proportions)
- 📉 Using too small a sample size leading to wide, less useful intervals
- 🤷 Reporting CI without context (e.g., sample size, confidence level, or what’s being measured)
🧠 Level-Up: Choosing Between T and Z
- Use T-distribution when:
- Estimating a mean
- Population standard deviation (σ) is unknown
- Sample size is small (n < 30)
- Use Z-distribution when:
- Estimating a proportion (e.g., % of users who clicked)
- Sample size is large
Tip: T is used far more often than Z in real-world analysis involving averages.
🧬 Why It Matters in Machine Learning
- 📊 Model Evaluation: Confidence intervals help quantify uncertainty in accuracy, precision, recall, etc.
- 📉 Generalization: CI offers a way to express how your model might perform on unseen data
- 🤖 A/B Testing: CI around click-through rates or conversion proportions guide data-driven product decisions
- ⚖️ Bias Detection: Confidence intervals allow comparison across subgroups (e.g., fairness across genders or regions)
📌 Try It Yourself: Confidence Interval Quiz
Q1: When should you use the T-distribution?
💡 Show Answer
When estimating a mean and the population standard deviation is unknown.Q2: What’s the formula for confidence intervals for proportions?
💡 Show Answer
\[ \hat{p} \pm Z \cdot \sqrt{\frac{\hat{p}(1 - \hat{p})}{n}} \]Q3: What happens when you increase your confidence level from 95% to 99%?
💡 Show Answer
The margin of error increases — your interval becomes wider.Q4: What’s the difference between T and Z distributions?
💡 Show Answer
T-distribution is used for small samples and unknown σ, Z is used for large samples and proportions.🧾 Summary: Key Takeaways
- ✅ Use T-distribution when estimating a mean with unknown population standard deviation.
- ✅ Use Z-distribution when estimating a proportion or when σ is known and sample size is large.
- 🧪 Check sample size: use T only if your sample is reasonably large or data is approximately normal.
- 🎯 Interpret CIs correctly: a 95% confidence interval means the method captures the true value 95% of the time.
- 🔍 Always report the confidence level, the estimate, and the full interval.
- 📊 Real-world data (like study hours or course completion rates) can be analyzed with these tools.
- 🤖 In ML, confidence intervals support robust reporting for metrics, A/B testing, and generalization checks.
📘 Use this post as a practical guide every time you work with statistical estimates in your analysis or models.
📺 Explore the Channel

🎥 Hoda Osama AI
Learn statistics and machine learning concepts step by step with visuals and real examples.
💬 Got a Question?
Leave a comment or open an issue on GitHub — I love connecting with other learners and builders. 🔁