How Random Is Random? Understanding Probability and Events
Ever flipped a coin and wondered why you got heads three times in a row? Welcome to the world of randomness and probability — where short-term surprises often give way to long-term patterns.
In this post, you’ll explore what randomness really means, how we use probability theory to measure uncertainty, and how concepts like sample space, mutual exclusivity, and tree diagrams help us model real-world randomness — from games to machine learning.
📚 This post is part of the "Intro to Statistics" series
🔙 Previously: Regression: Predicting Relationships Between Variables with the Best Fit Line
🔜 Next: Making Sense of Probabilities: Union, Tables, and Conditional Thinking
🎲 What is Randomness?
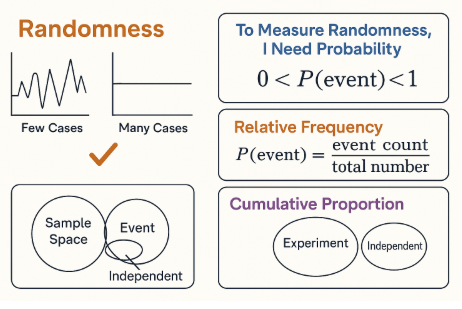
Randomness means outcomes vary in unpredictable ways — in the short run.
But here’s the twist:
✅ The more you repeat a random process, the more predictable the overall pattern becomes.
Example:
- Flip a coin 5 times → may get 3 heads, 2 tails
- Flip it 5,000 times → you’ll get close to 50% heads
📊 Visual: Randomness in Small vs Large Samples
🔍 Measuring Randomness with Probability
Probability is a number between 0 and 1 that describes the likelihood of an event.
\[ 0 < P(\text{event}) < 1 \]
- 0 → impossible
- 1 → certain
- 0.5 → equal chance
For any complete experiment:
\[ \sum P(\text{all possible events}) = 1 \]
📈 Relative Frequency & Cumulative Proportion
When observing events over time, we can estimate probability with relative frequency:
\[ P(\text{event}) = \frac{\text{event count}}{\text{total trials}} \]
The cumulative proportion is the running total of relative frequencies as trials increase — a clearer picture of probability.
🧠 Over time, the cumulative proportion settles down and reflects the true likelihood.
🧪 Basic Terms You Must Know
Experiment: A repeatable process with uncertain outcome
e.g. rolling a dieEvent: A specific result or set of results
e.g. rolling a 6, or getting an even numberIndependent Events: The result of one doesn’t affect the other
e.g. two separate coin tossesSample Space: The set of all possible outcomes
e.g. {1, 2, 3, 4, 5, 6} for a die
🌳 Using Tree Diagrams to Visualize Outcomes
Let’s say you toss a coin and then roll a die.
1
2
3
4
5
6
7
       Start
        |
    -----------
   H           T
 / | \       / | \
1  2  3     1  2  3 ...
Each branch represents a possible compound outcome (e.g. H-2), and we can multiply probabilities along the paths.
🧩 Event Types in Probability
Mutually Exclusive
Events that cannot happen at the same time
Example: Rolling a 2 and a 5 in one roll
\[ P(A \cap B) = 0 \]
Collectively Exhaustive
Events that together cover all possibilities
\[ \sum P(\text{events}) = 1 \]
Complement Event
All outcomes not in the event
\[ P(A^c) = 1 - P(A) \]
🔗 Disjoint vs Independent
| Type | Description | Rule |
|---|---|---|
| Disjoint (Mutually Exclusive) | Events don’t overlap | \( P(A \cap B) = 0 \) |
| Independent | Events don’t affect each other | \( P(A \cap B) = P(A) \cdot P(B) \) |
🔍 Venn Diagram: Disjoint vs Overlapping
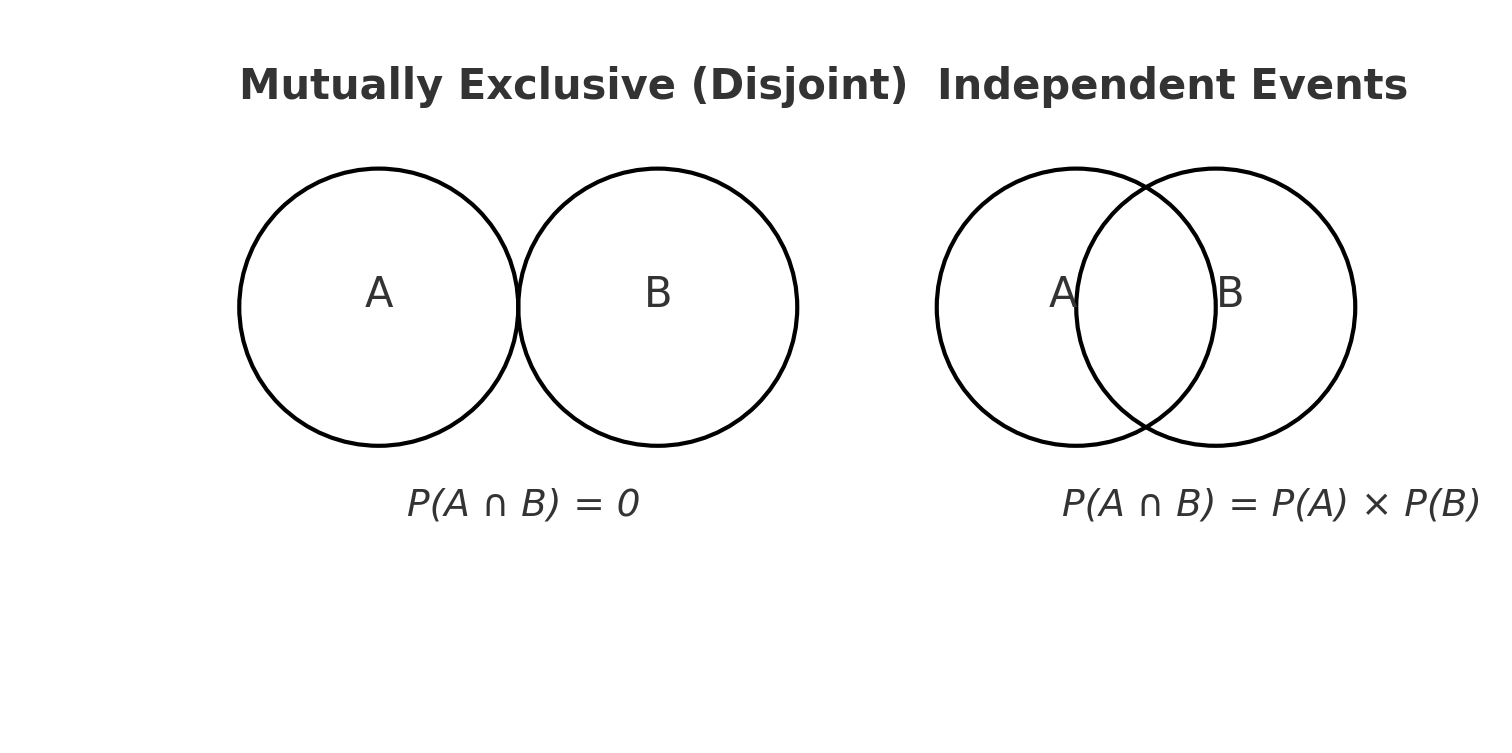
- Disjoint events → no overlap
Independent events → can overlap, but still multiply their probabilities
🤖 Why This Matters in Machine Learning
Probability and randomness aren’t just academic ideas — they power real-world machine learning.
- Algorithms like Naive Bayes and Hidden Markov Models rely on probabilistic logic.
- Concepts like independence and conditional probability are fundamental in model design.
- Randomness underlies cross-validation, bootstrapping, and even neural network weight initialization.
Understanding these foundations helps you avoid black-box thinking — and build better models.
📌 Try It Yourself: Randomness & Probability
Q1: In statistics, what does randomness really mean?
💡 Show Answer
It describes outcomes that are unpredictable in the short term, but follow consistent patterns over the long term.
Q2: What’s the valid range for a probability value?
💡 Show Answer
Between 0 and 1. That is, 0 ≤ P(event) ≤ 1.
Q3: What is a sample space in probability?
💡 Show Answer
The complete set of all possible outcomes for a random experiment.
Q4: If two events are mutually exclusive, what does that mean?
💡 Show Answer
They can’t happen at the same time. So, P(A ∩ B) = 0.
Q5: How do you calculate relative frequency?
💡 Show Answer
Relative Frequency = Number of desired outcomes ÷ Total number of trials
Q6: What’s the rule for the probability of two independent events both happening?
💡 Show Answer
P(A ∩ B) = P(A) × P(B) — because the outcome of one doesn’t affect the other.
🧠 Level Up: Why This Matters
Understanding randomness and events helps you:
- 🎯 Build simulations for decision-making
- 🧠 Model uncertainty in machine learning and forecasting
- 🔐 Analyze risk in finance, health, or engineering
Next, we’ll look at probability rules — like the addition and multiplication rule — and how they apply in real problems.
✅ Best Practices for Probability & Randomness
- Visualize compound events with tree diagrams to map all outcomes clearly.
- Use cumulative relative frequencies to estimate long-term probabilities.
- Differentiate between disjoint and independent events before applying rules.
- Always define your sample space explicitly — it frames every calculation.
⚠️ Common Pitfalls
- ❌ Assuming disjoint events are also independent — they’re not.
- ❌ Forgetting that probabilities must sum to 1 for all possible outcomes.
- ❌ Expecting short-term outcomes to always balance — this Gambler’s Fallacy is misleading.
- ❌ Misinterpreting randomness as lack of pattern — patterns can emerge from chance!
🧠 Summary
| 🎯 Concept | 💡 Meaning |
|---|---|
| Randomness | Unpredictable short-term, predictable long-term |
| Probability | Likelihood of an event (between 0 and 1) |
| Relative Frequency | Estimate based on observed trials |
| Sample Space | All possible outcomes |
| Mutually Exclusive | Can’t happen together |
| Collectively Exhaustive | Together cover all possibilities |
| Complement | All other outcomes |
| Independent | One event doesn’t affect the other |
| Tree Diagram | Shows compound outcomes |
| Venn Diagram | Visualize event relationships |
✅ Up Next
In the next post, we’ll explore:
- Addition Rule for combined events
- Multiplication Rule for independent events
- Conditional Probability and its meaning
Stay curious!
📺 Explore the Channel

🎥 Hoda Osama AI
Learn statistics and machine learning concepts step by step with visuals and real examples.
💬 Got a Question?
Leave a comment or open an issue on GitHub — I love connecting with other learners and builders. 🔁