Significance Test for a Population Mean
Learn how to conduct a one-sample T-test for a population mean using hypothesis testing, T-scores, and critical values. Understand when and why to use the T-distribution.
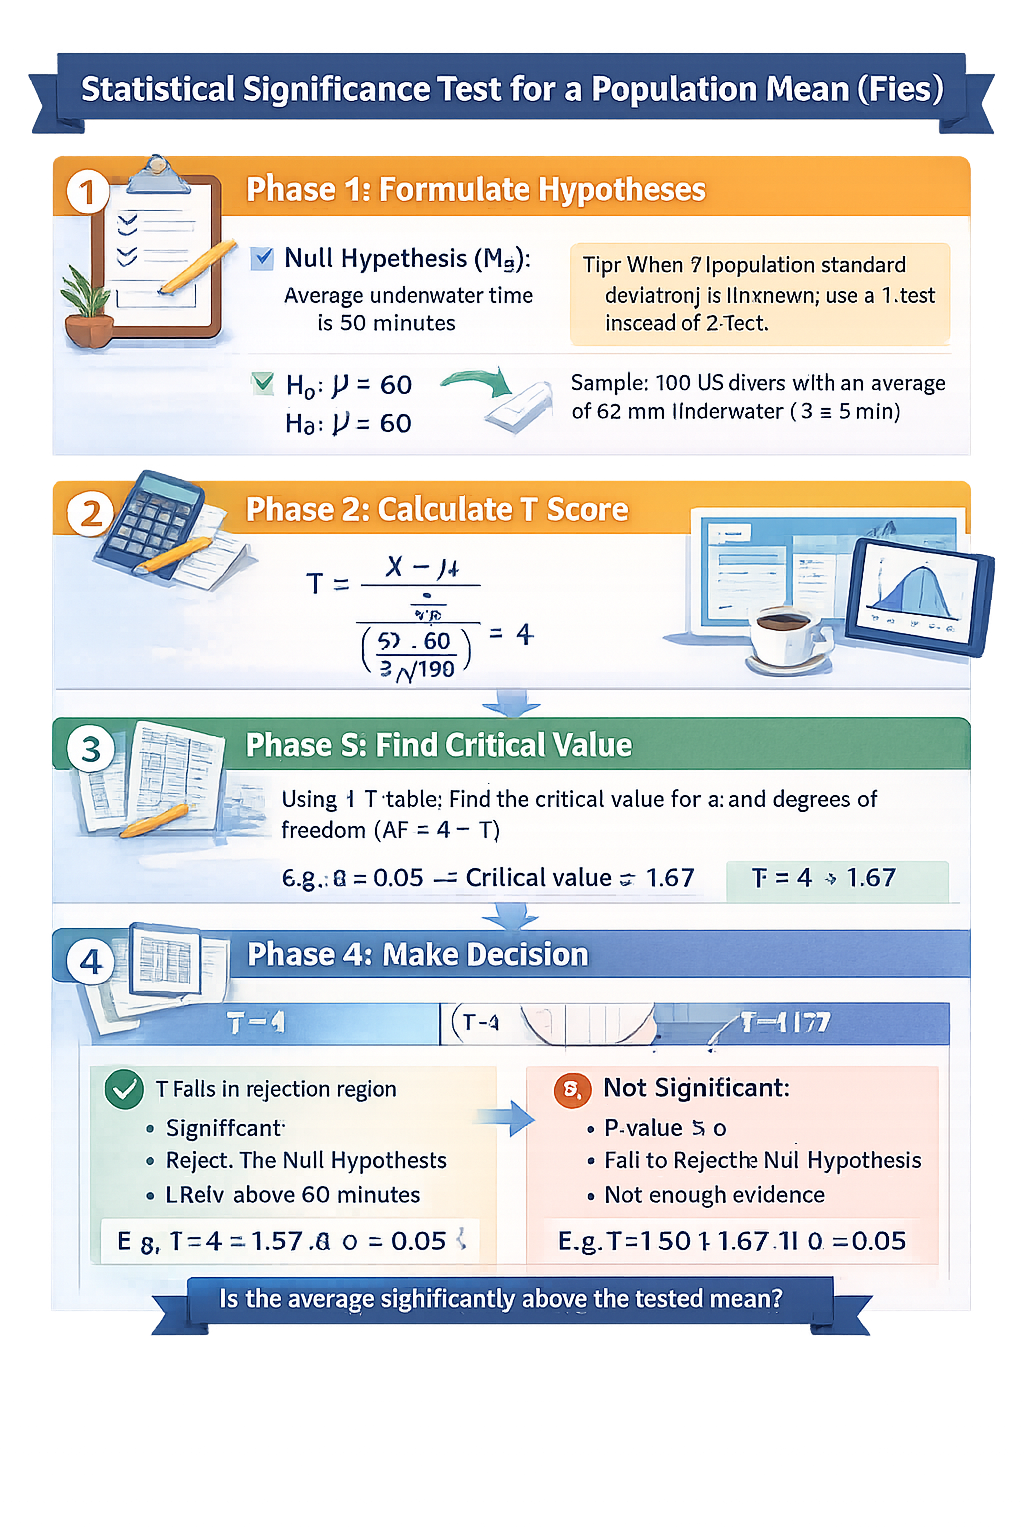
This video explains how to conduct a statistical significance test for a population mean (specifically using a T-test). It uses a practical example involving the underwater time of professional divers in the US.
You’ll learn how to set up hypotheses, calculate the T-score (since the population standard deviation is unknown), and compare it against a critical value to make a decision. The video also covers one-tailed vs. two-tailed tests and the impact of significance levels ($\alpha$).
🧠 MAIN POINTS
- Hypothesis Testing for Mean: Focuses on the average value ($\mu$) of a population.
- T vs. Z: If the population standard deviation ($\sigma$) is unknown, use the sample standard deviation ($S$) → use the T-distribution.
- T-Score Formula: \(T = \frac{\bar{x} - \mu}{\frac{S}{\sqrt{n}}}\)
- Critical Value Decision: Compare the T-score to the critical value based on degrees of freedom and your $\alpha$ level.
🔬 CASE STUDY: Oxygen Endurance of Divers
Scenario:
Do US divers stay underwater more than 60 minutes?
- Null Hypothesis ($H_0$): $\mu = 60$
- Alternative Hypothesis ($H_a$): $\mu > 60$ (One-tailed)
Sample Data:
- Sample Size ($n$): 100
- Sample Mean ($\bar{x}$): 62
- Sample Std Dev ($S$): 5
Step 1: Standard Error
\(SE = \frac{5}{\sqrt{100}} = 0.5\)
Step 2: T-Score
\(T = \frac{62 - 60}{0.5} = 4\)
Step 3: Critical Value
- Degrees of Freedom: $n - 1 = 99$
- Critical T-value (( \alpha = 0.05 ), one-tailed): ≈ 1.67
✅ Decision:
Since $4 > 1.67$ → Reject $H_0$
✔ We have strong evidence the mean is greater than 60.
🔁 Two-Tailed Check (Stricter Test)
Test for $\mu \neq 60$ with $\alpha = 0.01$ (two-tailed):
Critical values: ±2.66
Result: $4 > 2.66$ → Still reject $H_0$
✔ Result is highly significant even with stricter conditions.
🧪 PRACTICAL PLAN: How to Run a T-Test
Phase 1: Setup
- Define $H_0$: e.g., “Average time = 60”
- Define $H_a$: e.g., “Average time > 60”
- Assumptions: If $n < 30$, data should be normally distributed
Phase 2: Calculation
- \(SE = \frac{S}{\sqrt{n}}\)
- \(T = \frac{\bar{x} - \mu}{SE}\)
Phase 3: Decision
- Find critical value from T-table (based on $n - 1$ and $\alpha$)
- Compare T-score with critical value
✅ Best Practices for T-Test for Means
- 🧪 Use a T-test when population standard deviation (σ) is unknown
- 📈 Report Degrees of Freedom (n − 1) when using t-distribution
- 📏 Check normality for small samples (n < 30) or rely on CLT for large samples
- 📊 Use one-tailed tests only with strong theoretical reasoning
- 📝 Clearly state your Null and Alternative Hypotheses in context
⚠ Common Pitfalls
- 🚫 Using Z-test when σ is unknown — use t-distribution instead
- 🔁 Incorrect degrees of freedom can affect critical values
- 🔍 Forgetting to check assumptions — normality or sample size adequacy
- 🤷♀️ Using a one-tailed test without justification
- 📉 Misinterpreting P-values — they don’t measure probability of hypotheses
🧠 Level-Up: Effect Size Matters
Even if your result is statistically significant, ask: Is it practically significant? Calculate Cohen's d to measure the effect size:
\[ d = \frac{\bar{x} - \mu_0}{s} \]
- Small effect: d = 0.2
- Medium effect: d = 0.5
- Large effect: d = 0.8+
🧬 Why It Matters in Machine Learning
- 🔎 Model Validation: T-tests help confirm if model performance metrics differ significantly between versions
- 📊 Feature Impact: Test if the average value of a feature differs across classes (e.g., fraud vs non-fraud)
- ⚖ Baseline Comparison: Validate uplift over baselines using sample means
📌 Try It Yourself: T-Test Quiz
Q1: When should you use the t-distribution instead of z-distribution?
💡 Show Answer
When the population standard deviation is unknown.Q2: What’s the T-score formula?
💡 Show Answer
\[ T = \frac{\bar{x} - \mu_0}{SE} \] Where SE is the standard error, \( \frac{s}{\sqrt{n}} \)Q3: Why is it important to report degrees of freedom?
💡 Show Answer
Because it determines the critical value in the t-distribution.Q4: What does a small P-value mean?
💡 Show Answer
It means the observed result is unlikely under the Null Hypothesis — potential evidence against it.🧾 Summary
T-tests for means help determine whether your sample’s average truly differs from a known or hypothesized value. Always check assumptions, use the right distribution (t, not z), and understand both statistical and practical significance. A strong conclusion needs both correct math and context-aware interpretation.
📺 Explore the Channel

🎥 Hoda Osama AI
Learn statistics and machine learning concepts step by step with visuals and real examples.
💬 Got a Question?
Leave a comment or open an issue on GitHub — I love connecting with other learners and builders. 🔁