Statistical Significance Test for Proportions: How to Use Z-Scores and P-Values
Learn how to perform a one-tailed or two-tailed Z-test for a population proportion. This guide walks through hypothesis setup, Z-score calculation, and P-value interpretation with a real-world case.
Statistical significance testing is a key tool in data science and inferential statistics. This post breaks down how to test a claim about a population proportion using a step-by-step Z-test approach.
🎯 Real-World Scenario: Customer Conversion Rates
Let’s say you’re analyzing a marketing campaign and suspect that less than 12% of users are converting on a new landing page — which is underperforming compared to the company’s expectation of 12%.
🔢 Problem Setup
- Claim: Less than 12% of users convert.
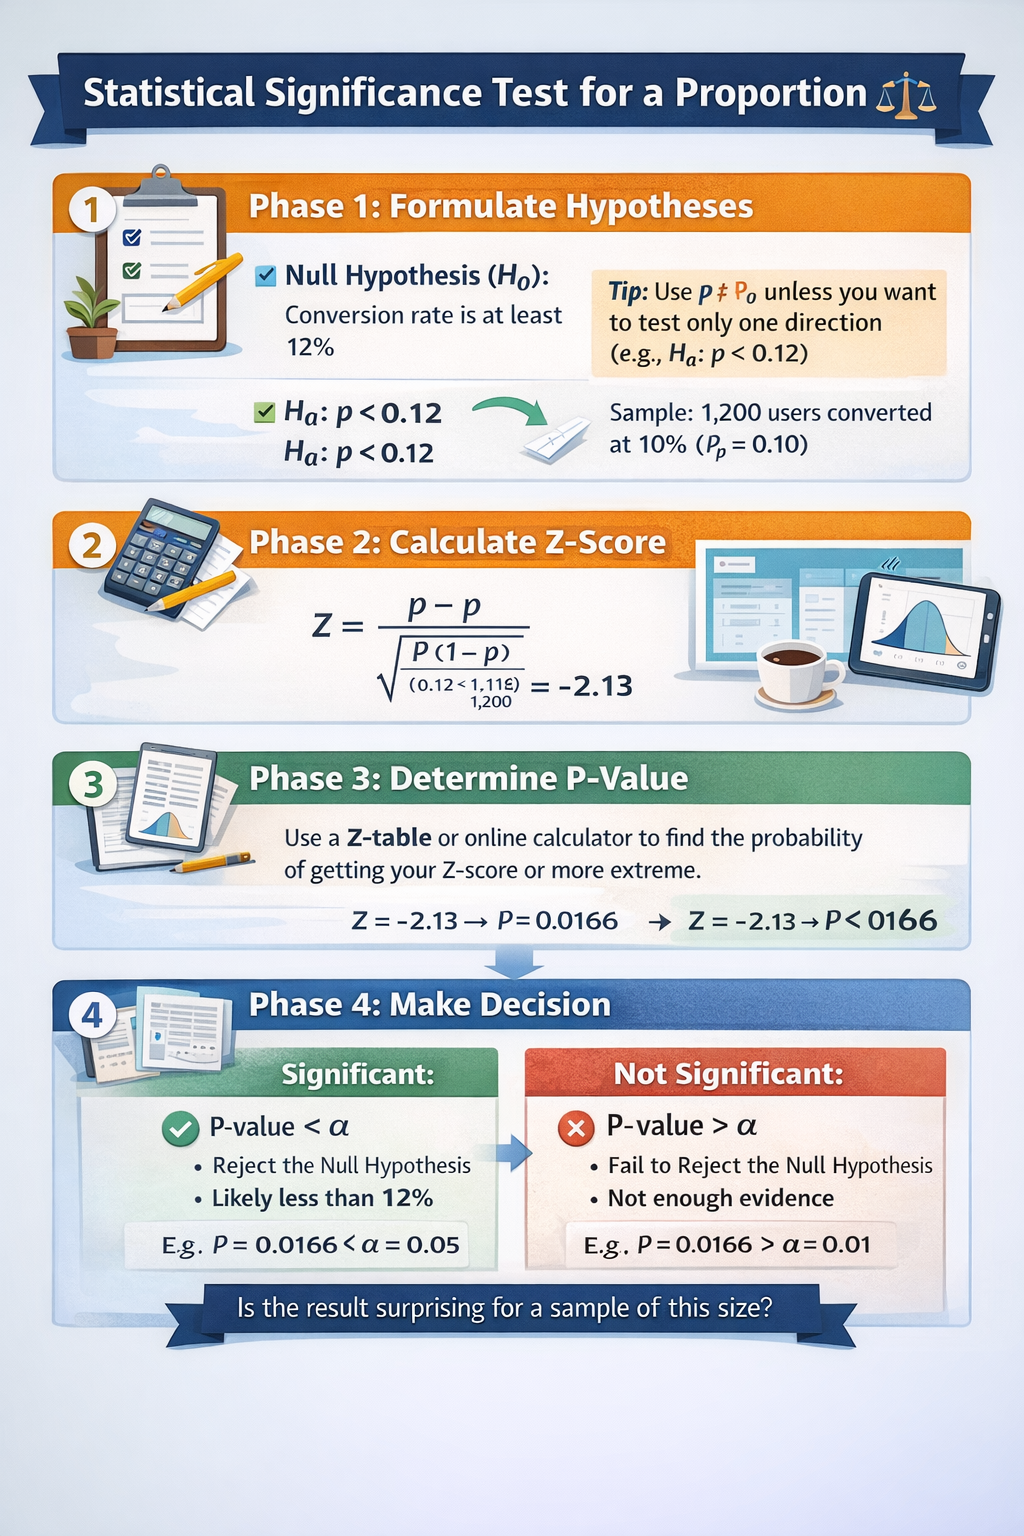
- Null Hypothesis ($H_0$): $P = 0.12$
- Alternative Hypothesis ($H_a$): $P < 0.12$
📊 Data Collected
- Sample Size ($n$): 1,200 users
- Sample Proportion ($\hat{p}$): 0.10 (10% converted)
🧮 Step-by-Step Calculation
Step 1: Calculate Standard Error (SE)
\[ SE = \sqrt{\frac{P(1 - P)}{n}} = \sqrt{\frac{0.12 \times 0.88}{1200}} \approx 0.0094 \]
Step 2: Calculate Z-Score
\[ Z = \frac{\hat{p} - P}{SE} = \frac{0.10 - 0.12}{0.0094} \approx -2.13 \]
Step 3: Determine P-Value
Using a Z-table or calculator:
P-value = 0.0166 (or 1.66%)
🧠 Interpretation Across Different Scenarios
Scenario A: One-Tailed, $\alpha = 0.05$
- P-value (0.0166) < 0.05
✅ Reject $H_0$ → There’s significant evidence the conversion rate is less than 12%.
Scenario B: Two-Tailed, $\alpha = 0.05$
In a two-tailed test, we check for deviation in both directions, so we must double the P-value.
- Calculated P-Value: $0.0166 \times 2 = 0.0332$
- Comparison: $0.0332 < 0.05$
- Conclusion: ✅ Reject $H_0$ → Even with the stricter requirement of a two-tailed test, our result remains statistically significant.
Scenario C: One-Tailed, $\alpha = 0.01$
- Critical Z = -2.33
- Our Z = -2.13 is not extreme enough →
❌ Fail to Reject $H_0$ → Not enough evidence at 1% level.
🛠️ Practical Plan: Run Your Own Test
Phase 1: Setup
- Define $H_0$ (status quo)
- Define $H_a$ (your belief or claim)
- Choose your significance level $\alpha$ (commonly 0.05)
Phase 2: Execution
- Collect random sample ($n$), compute $\hat{p}$
- Compute Z-score:
\[ Z = \frac{\hat{p} - P}{\sqrt{\frac{P(1-P)}{n}}} \]
Phase 3: Decision
- Use a calculator to find the P-value for your Z-score.
- If P-value < $\alpha$: Reject $H_0$
- If P-value > $\alpha$: Fail to reject $H_0$
✅ Best Practices for Proportion Hypothesis Testing
- 🧠 Use a one-tailed test only when you have a clear directional claim (e.g., "less than").
- 📏 Always define your alpha ($\alpha$) level before collecting data — typically 0.05 or 0.01.
- 📊 Check your sample size — both $n \cdot P$ and $n \cdot (1-P)$ should be ≥ 10 to use the Z-distribution.
- 🧮 Use exact P-values for clarity and precision in reporting.
- 📣 Clearly state your hypotheses and test type (one-tailed or two-tailed) to avoid ambiguity.
⚠ Common Pitfalls to Avoid
- 🚫 Switching between one-tailed and two-tailed after seeing the results — this invalidates the test.
- 🔢 Using sample proportion ($\hat{p}$) in place of population proportion (P) when calculating SE.
- 📉 Ignoring the assumptions of the normal approximation — especially for small samples.
- 🤷♂️ Confusing P-value with probability of $H_0$ being true — it doesn’t work that way!
- 📊 Forgetting to report the Z-score and P-value in your conclusions.
🧠 Level-Up: One-Tailed vs Two-Tailed
- Use a one-tailed test when:
- You’re only interested in deviation in one direction (e.g., "less than 12%").
- Use a two-tailed test when:
- You care about any significant deviation (either higher or lower).
Pro Tip: Two-tailed tests are more conservative but more common in formal research.
🧬 Why It Matters in Machine Learning
- 🎯 Model Evaluation: You can use hypothesis testing to compare error rates of different models statistically.
- 📈 A/B Testing: Hypothesis tests help determine whether model performance improvements are significant.
- 🤖 Feature Selection: Statistical significance can guide which features impact model performance.
- 🧪 Experimentation: Validates whether observed performance differences are meaningful or random.
📌 Try It Yourself: Proportion Z-Test Quiz
Q1: What’s the standard error formula for a population proportion?
💡 Show Answer
\[ SE = \sqrt{\frac{P(1-P)}{n}} \]Q2: What happens if you lower your alpha from 0.05 to 0.01?
💡 Show Answer
It becomes harder to reject $H_0$ — your test is more strict and less prone to false positives.Q3: When should you use a two-tailed test?
💡 Show Answer
When you're testing for any difference — not just an increase or a decrease.Q4: What does a P-value of 0.04 mean if your alpha is 0.05?
💡 Show Answer
You reject the null hypothesis — your result is statistically significant.🧾 Summary
This post walked through the process of conducting a Z-test for a population proportion. Starting from hypothesis formulation to calculating the Z-score and evaluating the P-value, you learned how to decide whether your sample supports the claim about the population.
✅ A low P-value indicates that your data is unlikely under the Null Hypothesis, leading you to reject $H_0$.
❌ A high P-value means your result is likely due to chance, and you fail to reject $H_0$.
You also saw how changing the test type (one-tailed vs. two-tailed) or significance level ($\alpha$) affects your result. This is critical in fields like business analytics, A/B testing, and machine learning, where decisions must be statistically sound.
By applying these principles carefully, you ensure your findings are both valid and impactful.
📺 Explore the Channel

🎥 Hoda Osama AI
Learn statistics and machine learning concepts step by step with visuals and real examples.
💬 Got a Question?
Leave a comment or open an issue on GitHub — I love connecting with other learners and builders. 🔁