Statistical Hypotheses: How to Form and Test Assumptions with Data
Learn how to formulate null and alternative hypotheses, understand their role in statistical significance testing, and apply them through real-world examples like click-through rates and server response times.
📊 Statistical Hypotheses: The Foundation of Significance Testing
This post introduces Statistical Hypotheses, the starting point for Significance Testing in inferential statistics. You’ll learn how to:
- Formulate null and alternative hypotheses.
- Understand the logic behind testing them.
- Apply real-world examples from tech and data scenarios.
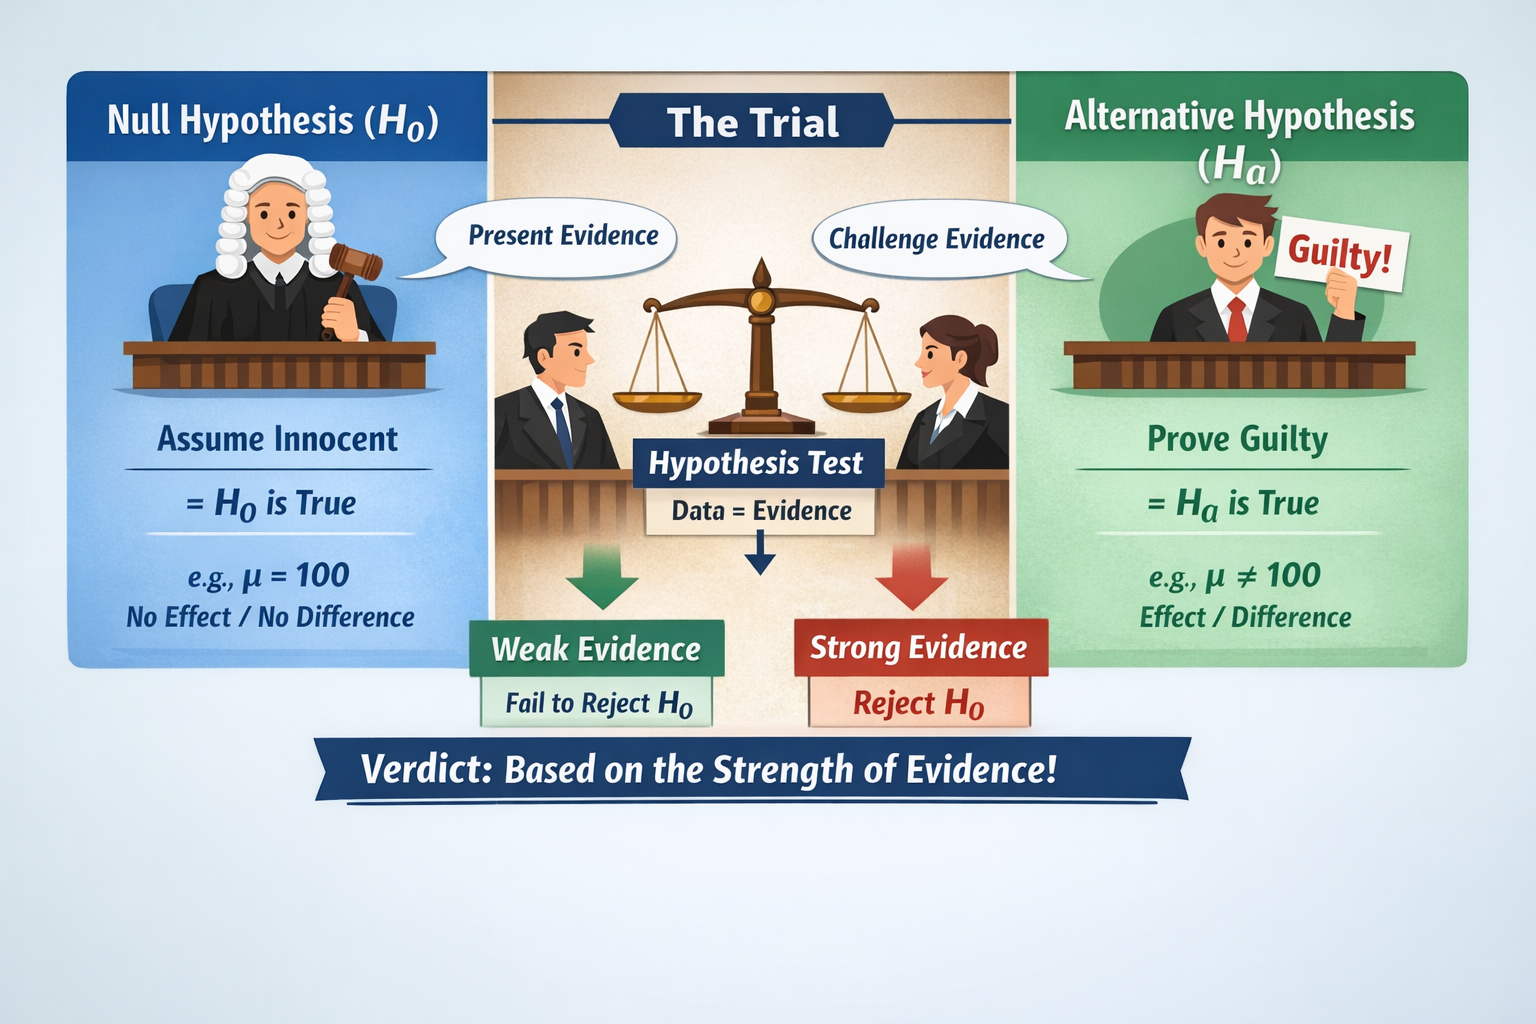
The courtroom analogy makes it clear: we assume innocence (the null hypothesis $H_0$) until evidence supports a different claim (the alternative hypothesis $H_a$).
🔍 Main Concepts
What is a Hypothesis?
A statistical hypothesis is a claim or assumption about a population parameter — typically a mean (μ) or proportion (p).
Types of Hypotheses:
- Null Hypothesis ($H_0$): The default assumption. States that there is no effect or no difference (e.g., $p = 0.25$).
- Alternative Hypothesis ($H_a$): What you’re trying to support — that there is an effect or difference (e.g., $p > 0.25$).
- They are mutually exclusive: only one can be true.
⚖️ The Courtroom Analogy
- $H_0$ = Innocent until proven guilty.
- Data = Evidence. The trial tests whether evidence strongly contradicts $H_0$.
- If the evidence is weak: we fail to reject $H_0$.
- If the evidence is strong: we reject $H_0$ in favor of $H_a$.
🧪 Real-World Examples (Updated)
📈 Example 1: Click-Through Rate (Proportion)
Scenario:
A data analyst wants to test whether the new homepage design increases click-through rates above the current benchmark of 25%.
- Null Hypothesis ($H_0$): $p = 0.25$
- Alternative Hypothesis ($H_a$): $p > 0.25$
- Type: One-tailed proportion test
If a random sample of 200 users shows that 64 clicked (click rate = 0.32), this test can determine if the difference is statistically significant or due to chance.
🧠 Example 2: Server Response Time (Mean)
Scenario:
An ML engineer suspects that a new backend model slows response time compared to the current standard of 120ms.
- Null Hypothesis ($H_0$): $\mu = 120$
- Alternative Hypothesis ($H_a$): $\mu > 120$
- Type: One-tailed mean test
A sample of 40 responses from the new model shows a mean of 127.5ms with a standard deviation of 15ms. Is this increase significant?
✅ Practical Plan: How to Formulate a Hypothesis Test
🔹 Phase 1: Define Your Claim
- Identify the Parameter: Are you testing a mean (μ) or a proportion (p)?
- Define $H_a$: What outcome do you want to support? Use inequalities ($<, >, eq$).
🔹 Phase 2: Set the Baseline
- Define $H_0$: This is the claim of “no change”, always using equality.
🔹 Phase 3: Conduct the Test
- Collect sample data.
- Analyze: Does the evidence contradict $H_0$ strongly enough?
- Conclude: Reject $H_0$ only if results are statistically significant.
⚠️ Important: If results are not significant, you do not confirm $H_0$ is true — you only “fail to reject” it due to insufficient evidence.
✅ Best Practices for Hypothesis Testing
- 📚 Always define both $H_0$ and $H_a$ clearly before collecting data
- 🎯 Use one-tailed tests only when your research question has a clear direction (e.g., $H_a$: $p > 0.3$)
- 📊 Select the appropriate test: Use Z-tests for proportions and T-tests for means with unknown σ
- 📈 Report the p-value and compare it with a significance level (usually 0.05)
- 🧪 Include context for your conclusion: explain practical implications of rejecting or not rejecting $H_0$
⚠ Common Pitfalls in Hypothesis Testing
- 🚫 Failing to define hypotheses properly before analyzing the data
- ❌ Using a one-tailed test when a two-tailed test is required
- 😬 Misinterpreting "fail to reject $H_0$" as proof that $H_0$ is true
- 🔍 Ignoring assumptions such as sample independence or normality (for T-tests)
- 📉 Basing conclusions on anecdotal or biased samples
🧠 Level-Up: One-Tailed vs. Two-Tailed Tests
- One-Tailed Test: Use when your alternative hypothesis points in a specific direction:
- e.g., $H_a$: $\mu > 100$ or $p < 0.3$
- Two-Tailed Test: Use when you're testing for any difference (no specific direction):
- e.g., $H_a$: $\mu eq 100$
Tip: When in doubt, choose the two-tailed test — it's more conservative and widely used in scientific research.
🧬 Why It Matters to Machine Learning
- 🤖 Model Validation: Hypothesis testing helps verify if performance improvements are statistically significant
- 🧪 A/B Testing: Common in ML product pipelines for comparing models, interfaces, or features
- 🧠 Bias Detection: You can test if certain metrics differ across subgroups (e.g., fairness audits)
- 📊 Statistical significance provides evidence that generalizes beyond training data
- ⚙️ Noise Filtering: Helps avoid overreacting to random performance fluctuations
📌 Try It Yourself: Hypothesis Testing Quiz
Q1: What is the null hypothesis in a significance test?
💡 Show Answer
The default assumption that there's no effect or no difference in the population.Q2: Which hypothesis do we try to find evidence for?
💡 Show Answer
The alternative hypothesis ($H_a$).Q3: If you fail to reject the null hypothesis, what does it mean?
💡 Show Answer
There wasn't enough evidence to support the alternative; we keep $H_0$.Q4: When do you use a T-test instead of a Z-test?
💡 Show Answer
When the population standard deviation is unknown and you're testing a mean.Q5: What does “statistically significant” mean in hypothesis testing?
💡 Show Answer
The result is unlikely to have occurred by random chance alone under the null hypothesis.📝 Final Summary
- Hypothesis testing is a fundamental part of inferential statistics.
- It starts with a null hypothesis ($H_0$) that represents the status quo.
- You test sample data to determine whether there’s enough evidence to reject $H_0$ in favor of an alternative hypothesis ($H_a$).
- Always define your hypotheses before collecting data and use the correct test depending on whether you’re analyzing means (T-test) or proportions (Z-test).
- In machine learning, hypothesis testing helps validate models, ensure robustness, and support decision-making based on evidence rather than assumptions.
Use these principles to strengthen the credibility of your data insights. 🚀
📺 Explore the Channel

🎥 Hoda Osama AI
Learn statistics and machine learning concepts step by step with visuals and real examples.
💬 Got a Question?
Leave a comment or open an issue on GitHub — I love connecting with other learners and builders. 🔁