Understanding Binomial Distribution
Learn how the binomial distribution works in statistics and machine learning. Explore real-world examples, formulas, and how to calculate success probabilities in binary events.
🎯 What is Binomial Distribution?
The binomial distribution is a powerful statistical tool used to model the number of successes in a fixed number of trials, each with the same probability of success. Whether you’re testing products, analyzing survey responses, or building a machine learning classifier, understanding how binomial outcomes work helps you make smarter, data-driven decisions. In this post, you’ll learn how to recognize binomial settings, calculate probabilities, and apply the formula to real-world and ML-inspired scenarios.
📚 This post is part of the "Intro to Statistics" series
🔙 Previously: Understanding Z-Distribution and Using the Z-Table
🔜 Next: From Sample to Population: Basics of Sampling in Statistics
⚙️ Conditions for a Binomial Experiment
For a scenario to follow a binomial distribution, two essential conditions must be met:
- The probability of success \( p \) is constant for every trial.
- The trials are independent — the outcome of one does not affect the others.
🧱 Components of a Binomial Experiment
A binomial distribution is built on the following:
- A Bernoulli trial: one trial with two possible outcomes (Success or Failure) and constant probability \( p \).
- Observe \( n \) such trials.
- Count the number of successes: \( x \).
📐 The Binomial Probability Mass Function (PMF)
The binomial formula calculates the probability of exactly \( x \) successes in \( n \) trials:
\[ P(X = x) = \binom{n}{x} p^x (1 - p)^{n - x} \]
Where:
- \( \binom{n}{x} = \frac{n!}{x!(n - x)!} \) is the number of combinations (“n choose x”)
- \( p \) is the probability of success
- \( 1 - p \) is the probability of failure
This is a probability mass function because it deals with discrete values.
🧮 Example: Tossing a Biased Coin
Suppose a coin has a 70% chance of landing heads (success). You flip it 5 times. What is the probability of getting exactly 3 heads?
Let:
- \( n = 5 \)
- \( x = 3 \)
- \( p = 0.7 \)
Then: \[ P(X = 3) = \binom{5}{3} (0.7)^3 (0.3)^2 = 10 \times 0.343 \times 0.09 = 0.3087 \]
So, there’s a 30.87% chance of getting exactly 3 heads.
💡Real-World Example: Spam Classification
Imagine you're evaluating a spam classifier. You test it on 20 emails known to be spam. The model correctly flags 15 of them as spam.
If the classifier has a true positive rate of 75%, what’s the probability of it flagging exactly 15 out of 20 correctly?
This is a classic case for the binomial probability formula:
P(X = 15) = C(20, 15) × (0.75)15 × (0.25)5
You can compute this using a calculator or code — this setup is common in model evaluation and A/B testing.
📈 Cumulative Binomial Probability
To find the probability of at most \( x \) successes:
\[ P(X \leq x) = \sum_{k=0}^{x} \binom{n}{k} p^k (1 - p)^{n - k} \]
🔍 Example:
You flip a fair coin \( n = 4 \) times. What’s the probability of getting at most 2 heads? Let \( p = 0.5 \)
\[ P(X \leq 2) = P(X=0) + P(X=1) + P(X=2) \]
Compute each:
- \( P(X=0) = \binom{4}{0}(0.5)^0(0.5)^4 = 1 \times 1 \times 0.0625 = 0.0625 \)
- \( P(X=1) = \binom{4}{1}(0.5)^1(0.5)^3 = 4 \times 0.5 \times 0.125 = 0.25 \)
- \( P(X=2) = \binom{4}{2}(0.5)^2(0.5)^2 = 6 \times 0.25 \times 0.25 = 0.375 \)
\[ P(X \leq 2) = 0.0625 + 0.25 + 0.375 = 0.6875 \]
So, there’s a 68.75% chance of getting 2 or fewer heads.
🧭 Symmetry and Skewness
The shape of a binomial distribution depends on the probability ( p ):
- If \( p = 0.5 \): the distribution is symmetric.
- If \( p < 0.5 \): it is right-skewed.
- If \( p > 0.5 \): it is left-skewed.
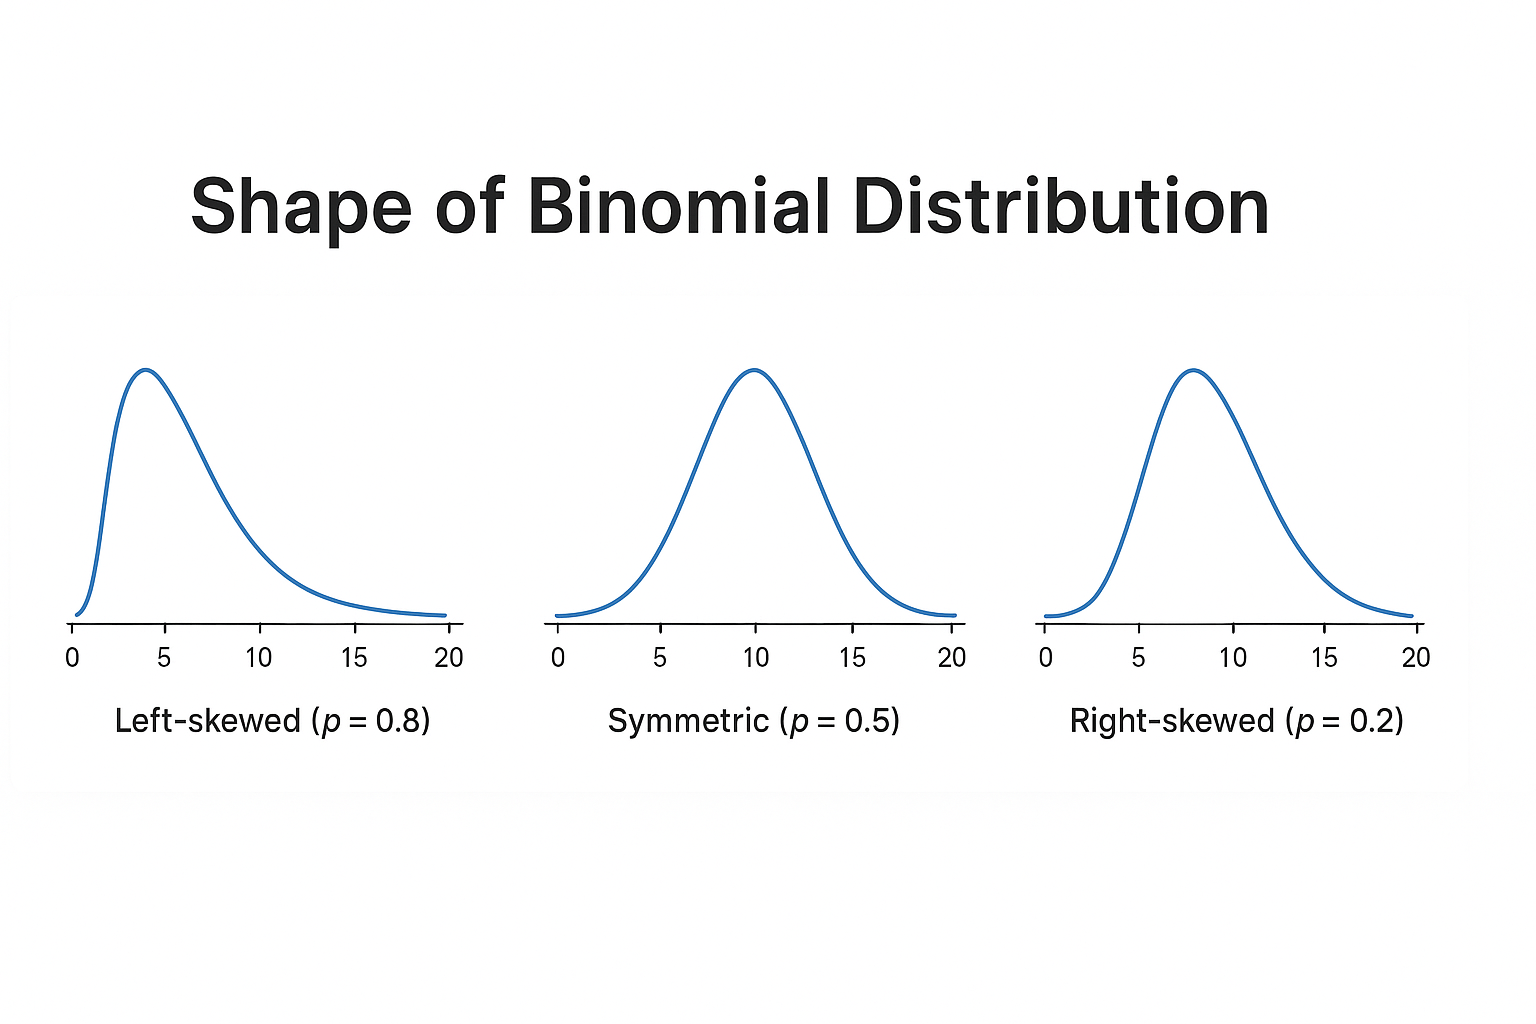
The spread is widest when the distribution is symmetric (i.e., ( p = 0.5 )).
📊 Mean and Standard Deviation
The Mean (Expected Value) and Standard Deviation give insights into the center and spread of the distribution:
✅ Mean (\( \mu \)):
\[ \mu = n \cdot p \] This tells us the average number of successes over many trials.
✅ Standard Deviation (\( \sigma \)):
\[ \sigma = \sqrt{n \cdot p \cdot (1 - p)} \] This quantifies the variability around the mean.
📌 Example:
You roll a die 12 times. The chance of rolling a 6 (success) is \( p = \frac{1}{6} \). What are the mean and standard deviation?
- \( n = 12 \)
- \( p = \frac{1}{6} \)
\[ \mu = 12 \cdot \frac{1}{6} = 2 \] \[ \sigma = \sqrt{12 \cdot \frac{1}{6} \cdot \frac{5}{6}} = \sqrt{1.6667} \approx 1.29 \]
So, you expect on average 2 sixes, with a standard deviation of about 1.29.
🤖 Relevance to Machine Learning
- Bernoulli & Binomial distributions are foundational in probabilistic models — e.g., Naive Bayes, logistic regression.
- Binary classification tasks often assume Bernoulli trials (success/failure).
- Performance metrics (like precision and recall) relate to binomial outcomes in repeated experiments (e.g., cross-validation).
- Understanding binomial assumptions helps assess model calibration and confidence estimation.
🧠 Level Up: When to Use the Binomial Model
- The binomial model is perfect for yes/no, win/lose, pass/fail scenarios.
- It's used in genetics, quality control, clinical trials, and surveys.
- When \( n \) is large and \( p \) isn't too close to 0 or 1, the binomial distribution approximates the normal distribution.
- Use statistical software or binomial calculators when \( n \) is big or cumulative probabilities are needed.
✅ Best Practices
- ✅ Verify all trials are independent before applying the binomial model.
- ✅ Use binomial formulas when dealing with binary outcomes (e.g., yes/no, win/loss).
- ✅ Use a binomial calculator or code for large \( n \), to avoid factorial overflows.
- ✅ Know when to use cumulative probability vs. exact success count.
⚠️ Common Pitfalls
- ❌ Applying binomial logic when trials are not independent (e.g., without replacement).
- ❌ Confusing binomial distribution with geometric or Poisson models.
- ❌ Forgetting the fixed number of trials condition (must know \( n \)).
- ❌ Misinterpreting “at most” vs “exactly” in cumulative questions.
📌 Try It Yourself: Binomial Distribution
Q1: A binomial experiment has \( n = 10 \) and \( p = 0.6 \). What is the expected number of successes?
💡 Show Answer
- A) 4
- B) 6 ✓
- C) 10
- D) 0.6
Q2: Which of the following conditions is not required for a binomial distribution?
💡 Show Answer
- A) Fixed number of trials
- B) Two outcomes per trial
- C) Changing probability of success ✓
- D) Independent trials
Q3: What is the formula for the standard deviation of a binomial distribution?
💡 Show Answer
- A) \( \mu = np \)
- B) \( \sigma = \sqrt{np(1 - p)} \) ✓
- C) \( \sigma = np^2 \)
- D) \( \sigma = n \cdot p \cdot (1 - p) \)
Q4: When \( p = 0.9 \) and \( n = 20 \), what is the shape of the distribution?
💡 Show Answer
- A) Symmetric
- B) Left-skewed ✓
- C) Right-skewed
- D) Uniform
Q5: Which of the following is a discrete probability distribution?
💡 Show Answer
- A) Normal distribution
- B) Binomial distribution ✓
- C) Exponential distribution
- D) Uniform (continuous) distribution
✅ Summary
| Concept | Description |
|---|---|
| Binary Outcome | Each trial has two outcomes: success or failure |
| Bernoulli Trial | A single trial with constant \( p \) |
| PMF | Formula: \( \binom{n}{x} p^x (1 - p)^{n - x} \) |
| Cumulative Probability | \( P(X \leq x) = \sum_{k=0}^x \binom{n}{k} p^k (1-p)^{n-k} \) |
| Symmetry & Skewness | Depends on \( p \): symmetric if \( p=0.5 \), right-skewed if \( p < 0.5 \), left-skewed if \( p > 0.5 \) |
| Mean & Std. Dev. | \( \mu = np \), \( \sigma = \sqrt{np(1-p)} \) |
🔜 Up Next
Next, we’ll explore the Sampling Distribution of the Sample Mean — a fundamental concept in inferential statistics used to understand how sample means behave.
Stay curious!
📺 Explore the Channel

🎥 Hoda Osama AI
Learn statistics and machine learning concepts step by step with visuals and real examples.
💬 Got a Question?
Leave a comment or open an issue on GitHub — I love connecting with other learners and builders. 🔁