Understanding the Sampling Distribution of the Sample Mean and the Central Limit Theorem
The Central Limit Theorem (CLT) is a cornerstone of statistics and data science. It states that the distribution of sample means approaches a normal distribution as the sample size grows, regardless of the original population’s distribution. This powerful concept is essential for making statistical inferences, building confidence intervals, and running hypothesis tests. Whether you're analyzing user behavior in A/B testing or validating machine learning metrics, understanding CLT helps you interpret data more reliably and make better predictions.
🎯 Simple Random Samples and Sampling Distribution
When working with samples, the Simple Random Sample (SRS) is key — each sample must be a simple random sample.
If you take a set of samples, each one should be an SRS to ensure fairness and representativeness.
📚 This post is part of the "Intro to Statistics" series
🔙 Previously: From Sample to Population: Basics of Sampling in Statistics
🔜 Next: Population, Sample, and Sampling Distributions Explained
🔍 What is the Sampling Distribution of the Sample Mean?
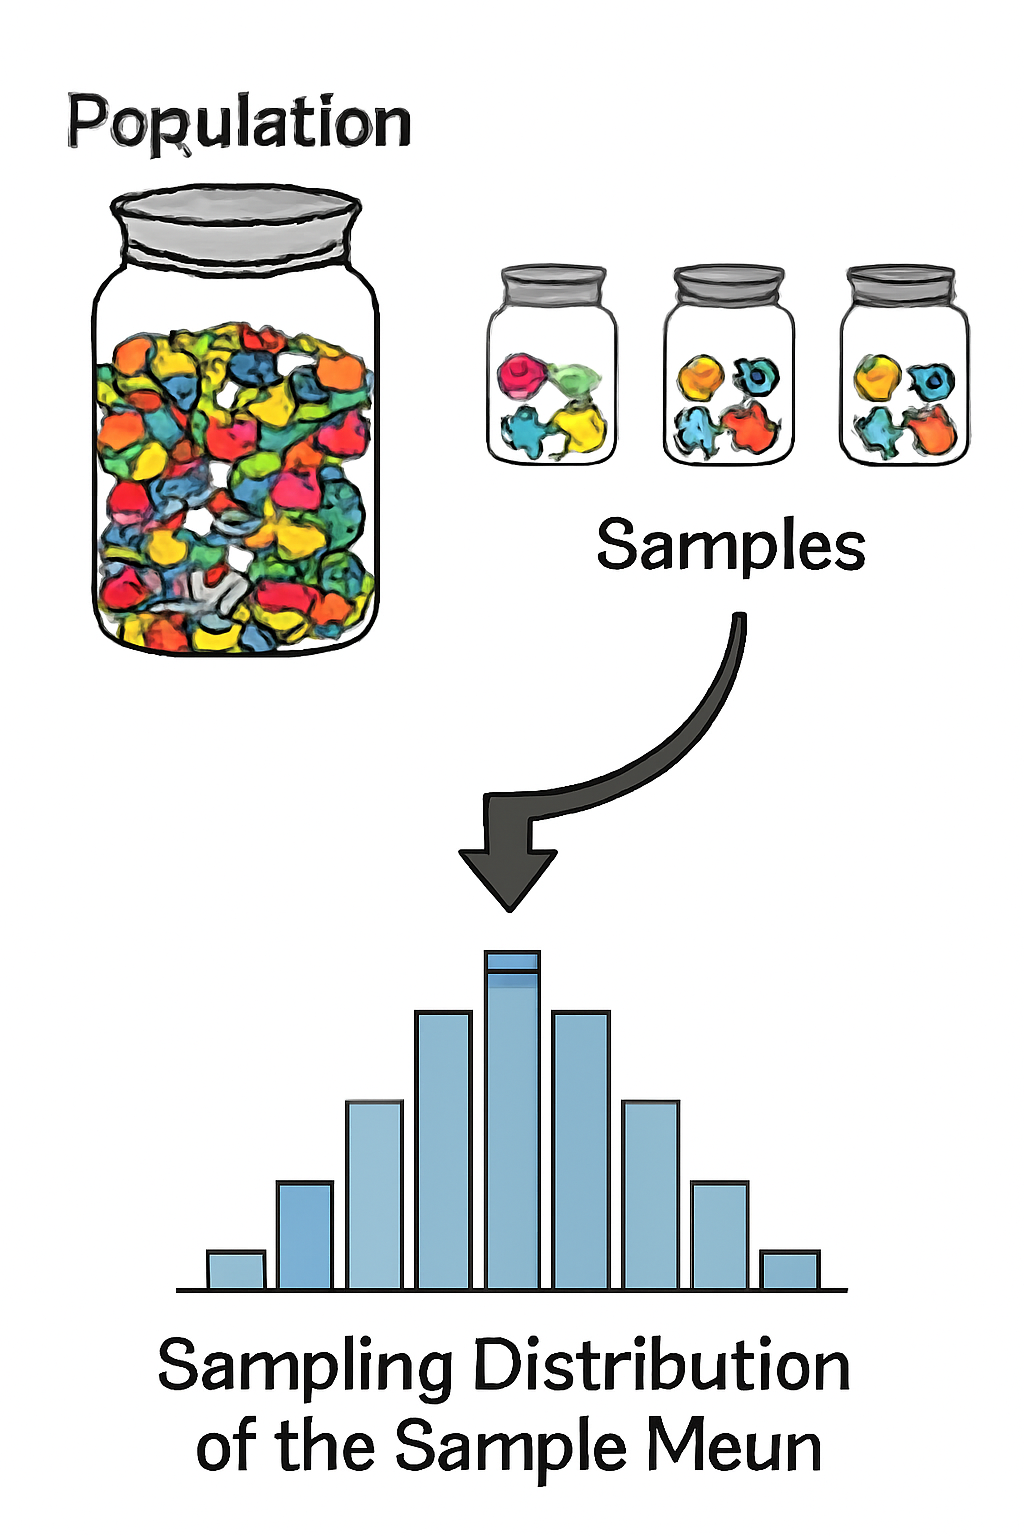
The sampling distribution of the sample mean is the probability distribution you get when you repeatedly take samples from a population, calculate their means, and plot those means.
💡 Sampling Distribution Example:
Imagine you have a large jar of mixed jellybeans with different colors. If you randomly scoop out small handfuls (samples) many times and calculate the average number of red jellybeans in each handful, the distribution of those averages forms the sampling distribution of the sample mean.
🧠 The Central Limit Theorem (CLT)
The CLT states:
Even if the population distribution is not normal, if you take a large number of samples (usually 30 or more), the distribution of the sample means will be approximately bell-shaped (normal).
This is a powerful result that lets us use normal distribution techniques even when the population isn’t normal.
📏 Properties of the Sampling Distribution
The mean of the sampling distribution (\( \mu_{\bar{x}} \)) equals the population mean \( \mu \).
The standard deviation of the sampling distribution (\( \sigma_{\bar{x}} \)), also called the standard error, is:
\[ \sigma_{\bar{x}} = \frac{\sigma}{\sqrt{n}} \]
where \( \sigma \) is the population standard deviation and \( n \) is the sample size.
A larger population standard deviation means a larger standard error.
A larger sample size means the sample means cluster closer to the population mean (smaller standard error).
🔍 Why Does This Matter?
Thanks to CLT:
You don’t need infinite samples to understand the distribution of sample means if you know \( \mu \) and \( \sigma \).
Any sample distribution for \( n \geq 30 \) tends to be normal or close to normal.
This allows statisticians to make reliable inferences about population parameters using sample data.
📊 Example
Suppose the average height in a city is 170 cm with a standard deviation of 10 cm.
If you take samples of size 36 people:
The mean of the sampling distribution will be \( \mu_{\bar{x}} = 170 \) cm.
The standard error will be:
\[ \sigma_{\bar{x}} = \frac{10}{\sqrt{36}} = \frac{10}{6} = 1.67 \text{ cm} \]
This means the average heights of samples of 36 people will vary with a standard deviation of 1.67 cm around the true mean.
📡 Relevance to Machine Learning
- CLT justifies why we can assume normality when evaluating model accuracy from sample metrics.
- It explains the reliability of performance estimates in cross-validation and A/B testing.
- Helps in interpreting confidence intervals and hypothesis tests during model evaluation.
- Supports probabilistic thinking required in Bayesian models and uncertainty quantification.
🧠 Level Up: Understanding the Central Limit Theorem
- The CLT is fundamental for making inferences from sample data when the population distribution is unknown.
- It justifies the widespread use of the normal distribution in hypothesis testing and confidence intervals.
- Even small samples from a normal population have normal sampling distributions; for non-normal populations, larger samples (usually \( n \geq 30 \)) are needed.
- The theorem enables statisticians to estimate probabilities about sample means without enumerating all possible samples.
✅ Best Practices When Using CLT
- Use CLT assumptions only when sample size is sufficient (typically \( n \geq 30 \)).
- Ensure sampling is random and independent to apply the theorem accurately.
- Understand the difference between sample distribution and sampling distribution.
⚠️ Common Pitfalls
- ❌ Assuming CLT applies to small, non-normal samples.
- ❌ Confusing standard deviation with standard error.
- ❌ Forgetting that CLT assumes independence between observations.
📌 Try It Yourself: Sampling Distribution & CLT
Q1: What is a simple random sample?
💡 Show Answer
- A) Every member has an equal chance of selection ✓
- B) Selecting based on convenience
- C) Sampling only volunteers
- D) Dividing the population into strata
Q2: What does the sampling distribution of the sample mean represent?
💡 Show Answer
- A) Distribution of population values
- B) Distribution of individual observations
- C) Distribution of sample means from many samples ✓
- D) Distribution of sample variances
Q3: According to the Central Limit Theorem, what shape does the sampling distribution approach?
💡 Show Answer
- A) Uniform
- B) Skewed left
- C) Bell-shaped (Normal) ✓
- D) Bimodal
Q4: How does increasing the sample size affect the standard error?
💡 Show Answer
- A) Increases it
- B) Decreases it ✓
- C) No effect
- D) Makes it unpredictable
Q5: What is the formula for the standard error of the sample mean?
💡 Show Answer
- A) \( \sigma \times \sqrt{n} \)
- B) \( \frac{\sigma}{n} \)
- C) \( \frac{\sigma}{\sqrt{n}} \) ✓
- D) \( \sqrt{\sigma \times n} \)
✅ Summary
| Concept | Description |
|---|---|
| Simple Random Sample (SRS) | Every member of the population has an equal chance of being selected. |
| Sampling Distribution | Distribution of sample means taken from many samples. |
| Central Limit Theorem (CLT) | For large enough samples, the distribution of sample means approaches normality, regardless of population shape. |
| Mean of Sampling Distribution | Equal to the population mean \( \mu \). |
| Standard Error | \( \sigma_{\bar{x}} = \frac{\sigma}{\sqrt{n}} \), variability of sample means. |
| Sample Size Impact | Larger samples yield smaller standard errors and sample means closer to population mean. |
🔜 Up Next
In the next post, we’ll explore the differences and relationships between the Population Distribution, Sample Distribution, and Sampling Distribution — key concepts for understanding statistical inference.
Stay curious! 📊
📺 Explore the Channel

🎥 Hoda Osama AI
Learn statistics and machine learning concepts step by step with visuals and real examples.
💬 Got a Question?
Leave a comment or open an issue on GitHub — I love connecting with other learners and builders. 🔁