Conditional vs. Marginal Proportions: What’s the Difference?
Understand the difference between marginal and conditional proportions using examples and contingency tables. A must-know concept for analyzing categorical data and preparing ML datasets.
When working with categorical data, two key concepts often confuse beginners: marginal proportions and conditional proportions. These show up everywhere — from surveys to machine learning datasets.
In this post, you’ll learn how to tell them apart, how to calculate each one, and when to use them.
🧮 Let’s Start with a Contingency Table
A school counselor surveys students about their study habits and quiz results.
Here’s a visual of the full table — with highlights to show how conditional and marginal proportions work:
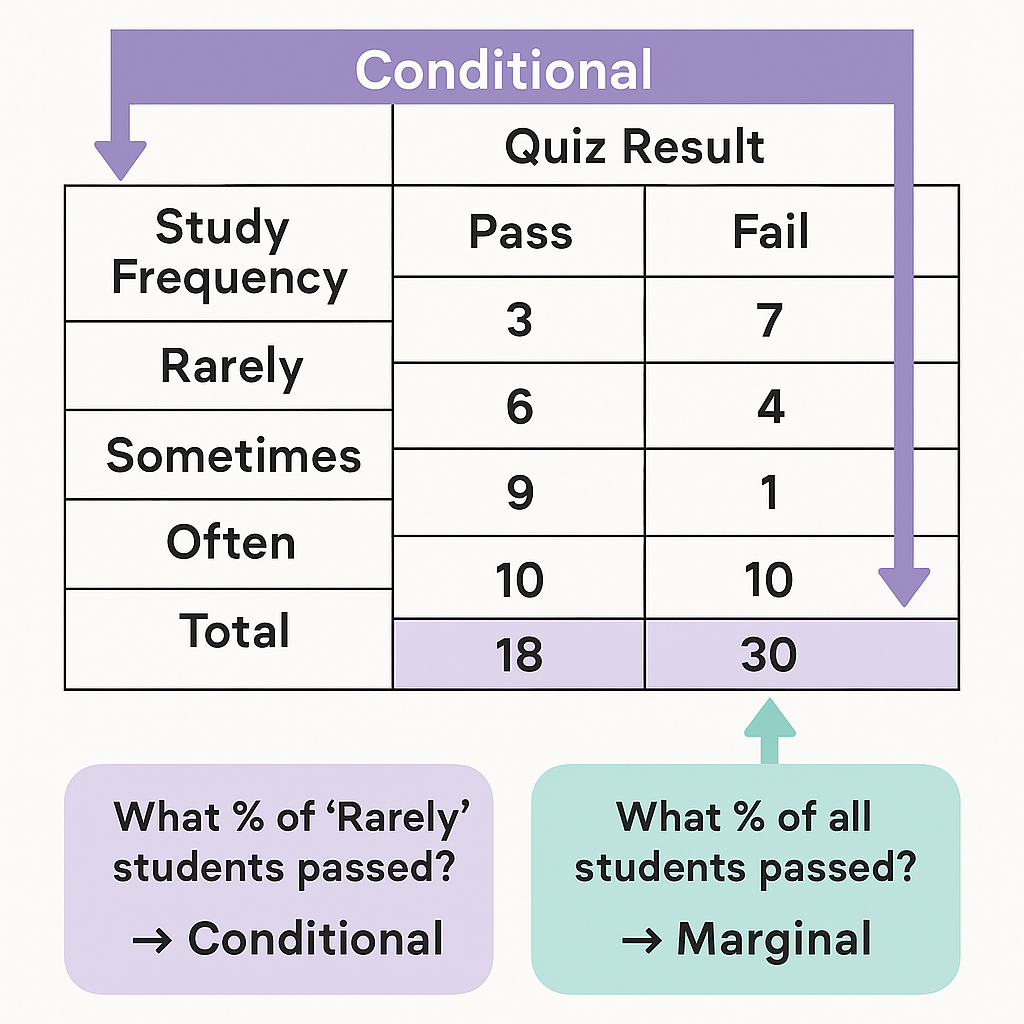
📋 Click to View: Full Study Frequency × Quiz Result Table
| Study Frequency \\ Quiz Result | Pass | Fail | Total |
|---|---|---|---|
| Rarely | 3 | 7 | 10 |
| Sometimes | 6 | 4 | 10 |
| Often | 9 | 1 | 10 |
| Total | 18 | 12 | 30 |
This table summarizes the relationship between two categorical variables:
- How often students study (Rarely, Sometimes, Often)
- Whether they passed or failed a quiz
🔁 Conditional Proportions
A conditional proportion asks:
“Given that we’re in a certain group, what percent have a specific outcome?”
It’s about looking within each row (or column) to compare outcomes relative to that group’s total.
💡 Example:
Among students who studied Rarely:
\[ P(\text{Pass} \mid \text{Rarely}) = \frac{3}{10} = 30\% \]Among those who studied Often:
\[ P(\text{Pass} \mid \text{Often}) = \frac{9}{10} = 90\% \]
| Study Frequency | % Passed | % Failed |
|---|---|---|
| Rarely | 30% | 70% |
| Sometimes | 60% | 40% |
| Often | 90% | 10% |
🧠 Why it matters:
Conditional proportions reveal associations between variables.
Here, we clearly see a trend: studying more = higher pass rate.
📊 Marginal Proportions
A marginal proportion answers:
“What percent of the entire dataset falls into this category?”
It’s calculated using the totals in the margins of the table — hence the name.
💡 Examples:
Proportion of all students who passed:
\[ P(\text{Pass}) = \frac{18}{30} = 60\% \]Proportion who studied Often:
\[ P(\text{Often}) = \frac{10}{30} = 33.3\% \]
🧠 Why it matters:
Marginal proportions describe each variable individually.
They help answer: “What percent of students passed overall?” or “How many students studied Often?”
🧩 Putting It All Together
Here’s a comparison to clarify:
| Type | What It Tells You | Formula |
|---|---|---|
| Marginal Proportion | Overall percent for a single category | Row/Column Total ÷ Grand Total |
| Conditional Proportion | Outcome percent within a specific group (adds to 100%) | Cell ÷ Row Total (or Column) |
✅ Use marginals for summarizing one variable
✅ Use conditionals to compare groups and spot patterns
✅ Best Practices for Proportions Analysis
- Use conditional proportions to compare group behavior (e.g., % who subscribe within each gender).
- Use marginal proportions to analyze overall distributions across the whole dataset.
- Make sure your conditional proportions add up to 100% across the condition variable.
- Visualize proportions using segmented bar charts or stacked bar plots.
⚠ Common Pitfalls to Avoid
- 🔁 Confusing marginal with conditional proportions — always check what the % is conditioned on.
- ❗ Misinterpreting conditional results as causal relationships — remember, these are descriptive!
- 📉 Ignoring totals — small subgroup sizes can make conditional percentages misleading.
- 📊 Visualizing incorrectly — don’t use pie charts to compare conditional percentages across groups.
📌 Try It Yourself
Q: In a study on exam performance, 80% of students who reported studying Often ended up passing the test.
Is this a marginal or conditional proportion?
💡 Show Answer
✅ Conditional — because it describes the percentage within a specific subgroup (students who studied "Often"), not across the entire population.
🧠 Why It Matters in Machine Learning
Understanding conditional and marginal proportions is essential in data preprocessing and feature evaluation. Whether you’re analyzing target distributions in classification tasks or evaluating categorical splits in decision trees, knowing how to interpret these proportions helps you avoid misleading patterns and build better models.
🧠 Summary
| Term | Meaning | Use Case |
|---|---|---|
| Marginal Proportion | Overall frequency of one category | “What % of all students passed?” |
| Conditional Proportion | % of outcome within a specific group | “What % of Rarely students passed?” |
🔗 Related Posts
- 📊 Explore how we used conditional proportions in a real study →
- 📈 Next: Pearson’s r — quantifying correlation for numeric data →
✅ TL;DR: Quick Recap
🟪 Marginal Proportion = Total % across everyone
👉 Example: What % of all students passed?
🟦 Conditional Proportion = % within a specific group
👉 Example: What % of students who studied Rarely passed?
📺 Explore the Channel

🎥 Hoda Osama AI
Learn statistics and machine learning concepts step by step with visuals and real examples.
💬 Got a Question?
Leave a comment or open an issue on GitHub — I love connecting with other learners and builders. 🔁