Understanding Dispersion: Range, IQR, and the Box Plot
Understand how data spreads using range, interquartile range (IQR), and box plots — with clear examples and why they matter in machine learning.
Understanding how data spreads is just as important as knowing its center. In this post, you’ll learn about dispersion — using the range, interquartile range (IQR), and box plots — and how these tools help identify outliers, variability, and improve machine learning models.
📚 This post is part of the "Intro to Statistics" series
🔙 Previously: Measuring the Center: Mean, Median, and Mode Explained
🔜 Next: Measuring Variability: Variance and Standard Deviation
📏 Range: A Simple Start
- Range = Largest value − Smallest value
\[ \text{Range} = x_{\max} - x_{\min} \]
- Gives a basic idea of spread
- But it’s not reliable for measuring variability if there are outliers
💡 Example:
If data = [5, 6, 6, 7, 95] →
\[ \text{Range} = 95 - 5 = 90 \]
🛑 That huge gap is because of one extreme value (an outlier).
📦 Interquartile Range (IQR)
To handle outliers, we use the IQR, which is based on quartiles:
| Quartile | Meaning |
|---|---|
| Q1 | 25% of data is below this point |
| Q2 | 50% (median) |
| Q3 | 75% of data is below this point |
🧮 Formula:
\[ \text{IQR} = Q_3 - Q_1 \]
- IQR focuses on the middle 50% of the data
- It removes the influence of extreme values
💡 Example:
Given ordered data:
[2, 4, 5, 7, 8, 10, 12, 15, 20, 22]
- There are 10 values in total.
- \( Q_1 \) is the median of the lower half \([2, 4, 5, 7, 8]\), which is 5.
- \( Q_3 \) is the median of the upper half \([10, 12, 15, 20, 22]\), which is 15.
\[ \text{IQR} = 15 - 5 = 10 \]
This means the middle half of the data spans 10 units.
📊 Box Plot: Best of Both Worlds
A box plot visually summarizes:
- The minimum and maximum values (excluding outliers)
- Q1, Q2 (median), and Q3
- Any outliers (points beyond 1.5×IQR from quartiles)
It’s one of the best visual tools to understand:
- Center
- Spread
- Skewness
- Outliers
🖼️ Visual: Anatomy of a Box Plot
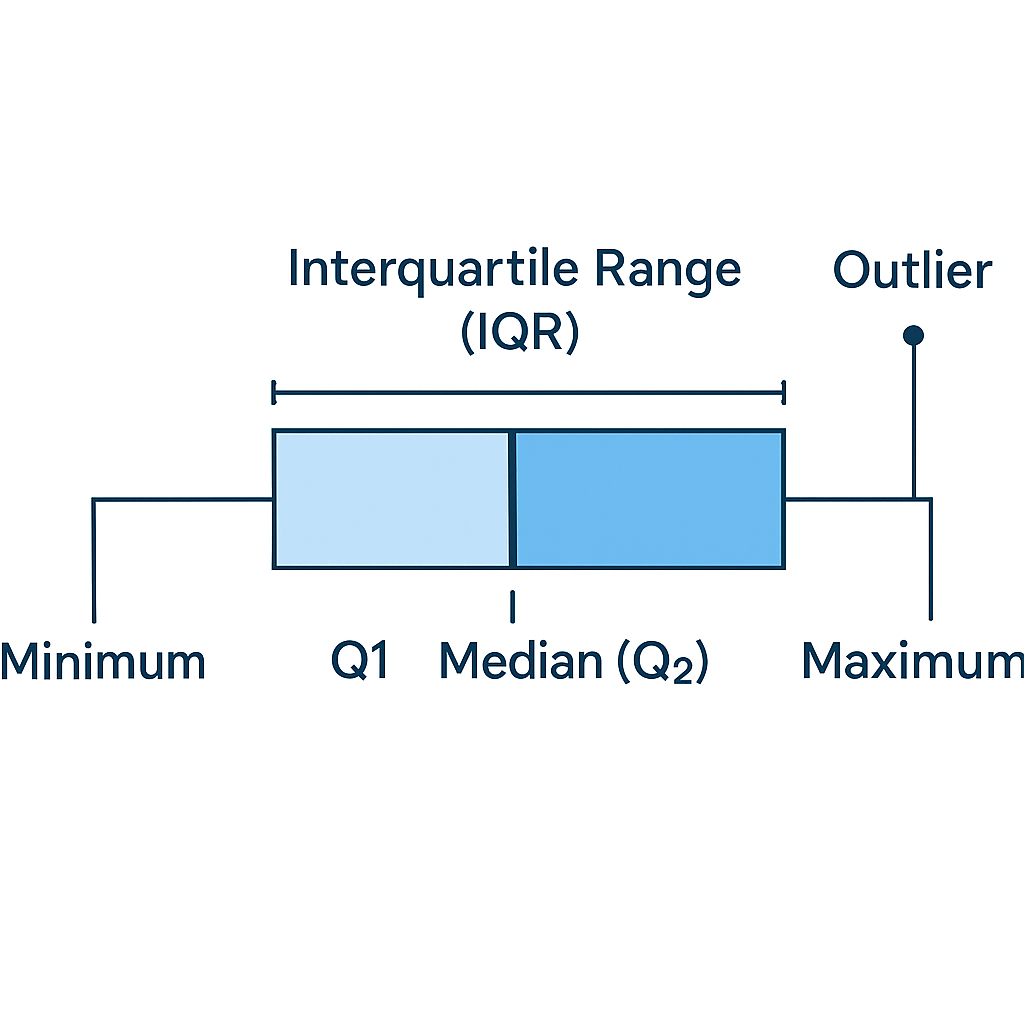
- Each 25% of data is shown as a section
- The box spans from Q1 to Q3
- The line in the middle is the median (Q2)
- Points outside the whiskers are outliers
To flag outliers, a common rule uses the IQR:
- Lower fence = \( Q_1 - 1.5 \times \text{IQR} \)
- Upper fence = \( Q_3 + 1.5 \times \text{IQR} \)
Values below the lower fence or above the upper fence are plotted as outliers in the box plot.
🎯 Why Not Just Use the Mean?
While central tendency is important, it’s not enough.
We need to know how spread out the data is — especially when comparing groups.
🧠 The box plot helps you see both center and variability.
🤖 Why Dispersion Matters in Machine Learning
- Outlier Detection: IQR and box plots help identify outliers, which can strongly affect model performance.
- Feature Selection: Features with almost no dispersion (nearly constant) often add little information, while features with extremely high dispersion may need transformation or robust scaling.
- Comparing Groups: Box plots make it easy to compare distributions across classes or experimental groups.
- Data Preprocessing: Understanding spread helps guide normalization, scaling, and robust imputation strategies.
In machine learning, understanding and visualizing data dispersion is essential for building reliable, interpretable models and for effective data cleaning.
For example, comparing box plots of a numeric feature across classes can show if that feature separates the classes well or if their distributions almost overlap.
📌 Try It Yourself
Q: Consider these two datasets:
- 📦 Dataset A: {10, 12, 12, 13, 13, 13, 14, 15}
- 📦 Dataset B: {10, 12, 13, 14, 15, 70}
Both datasets have the same median. Which one has a larger range, and what does that tell you about its spread?
💡 Show Answer
✅ Dataset B — it has a much larger range: 70 - 10 = 60 vs 15 - 10 = 5 in Dataset A.
This tells us that Dataset B includes a more extreme value — possibly an outlier — which greatly increases its range.
Bonus: Why might the IQR be a better measure of spread than the range in some cases?
💡 Show Answer
✅ The Interquartile Range (IQR) measures the spread of the middle 50% of the data.
It’s not affected by outliers, so it's a more reliable indicator of typical variability in skewed datasets.
✅ Best practices for range, IQR, and box plots
- Start simple, then go robust. Use the range for a quick first look at spread, then move to IQR and box plots when outliers are present.
- Always work with ordered data for quartiles. Sort the data before computing quartiles and IQR so the positions of Q1, Q2, and Q3 are correct.
- Use IQR and box plots when outliers matter. Prefer IQR and box plots over the range whenever extreme values could distort your view of typical variability.
- Compare groups visually. Use side by side box plots to compare the center, spread, and skewness of a feature across different classes or groups.
- Combine with numeric measures. Interpret range and IQR together with mean, median, and standard deviation to get a complete picture of the distribution.
⚠️ Common pitfalls with range, IQR, and box plots
- Relying only on the range. The range depends only on the two most extreme values and can be very misleading when outliers are present.
- Forgetting how quartiles are defined. Different software can use slightly different rules for quartiles, so small differences in Q1, Q3, or IQR are normal across tools.
- Misreading box plots. The whiskers do not always reach the absolute minimum and maximum; they usually stop at the most extreme non outlier values inside the fences.
- Treating every outlier as an error. Points outside the fences are not always mistakes; they can be real and important values that carry useful information.
- Ignoring sample size. For very small samples, box plots and quartiles can be unstable, so always consider how many observations are behind the plot.
🧠 Level Up: Understanding Variability Beyond the Range
While the range gives a simple measure of spread, it’s very sensitive to outliers — extreme values can distort your understanding.
- 📊 The IQR zeroes in on the middle 50% of data, making it more robust when outliers exist.
- 📦 The box plot visually separates the central bulk of data from outliers, showing you skewness and spread at a glance.
- 🔍 These tools are especially important in fields like finance, biology, and machine learning where outliers are common.
Mastering these measures will help you make better decisions and spot patterns that average measures alone can miss.
🔁 Summary
| Measure | What it tells us | Sensitive to outliers? |
|---|---|---|
| Range | Max − Min | ✅ Yes |
| IQR | Spread of middle 50% | ❌ No |
| Box Plot | Visual of quartiles & outliers | ❌ No |
✅ Up Next
Next, we’ll go deeper into numeric measures of variability:
- Variance
- Standard Deviation
And we’ll learn how to calculate and visualize them!
Stay tuned.
📺 Explore the Channel

🎥 Hoda Osama AI
Learn statistics and machine learning concepts step by step with visuals and real examples.
💬 Got a Question?
Leave a comment or open an issue on GitHub — I love connecting with other learners and builders. 🔁