Population, Sample, and Sampling Distributions Explained
Understanding the difference between population, sample, and sampling distributions is essential for data analysis, statistics, and machine learning. In this guide, we’ll explain each type of distribution with examples and visual aids, and show how they connect through standardization and the Central Limit Theorem.
📚 This post is part of the "Intro to Statistics" series
🔙 Previously: Understanding the Sampling Distribution of the Sample Mean and the Central Limit Theorem
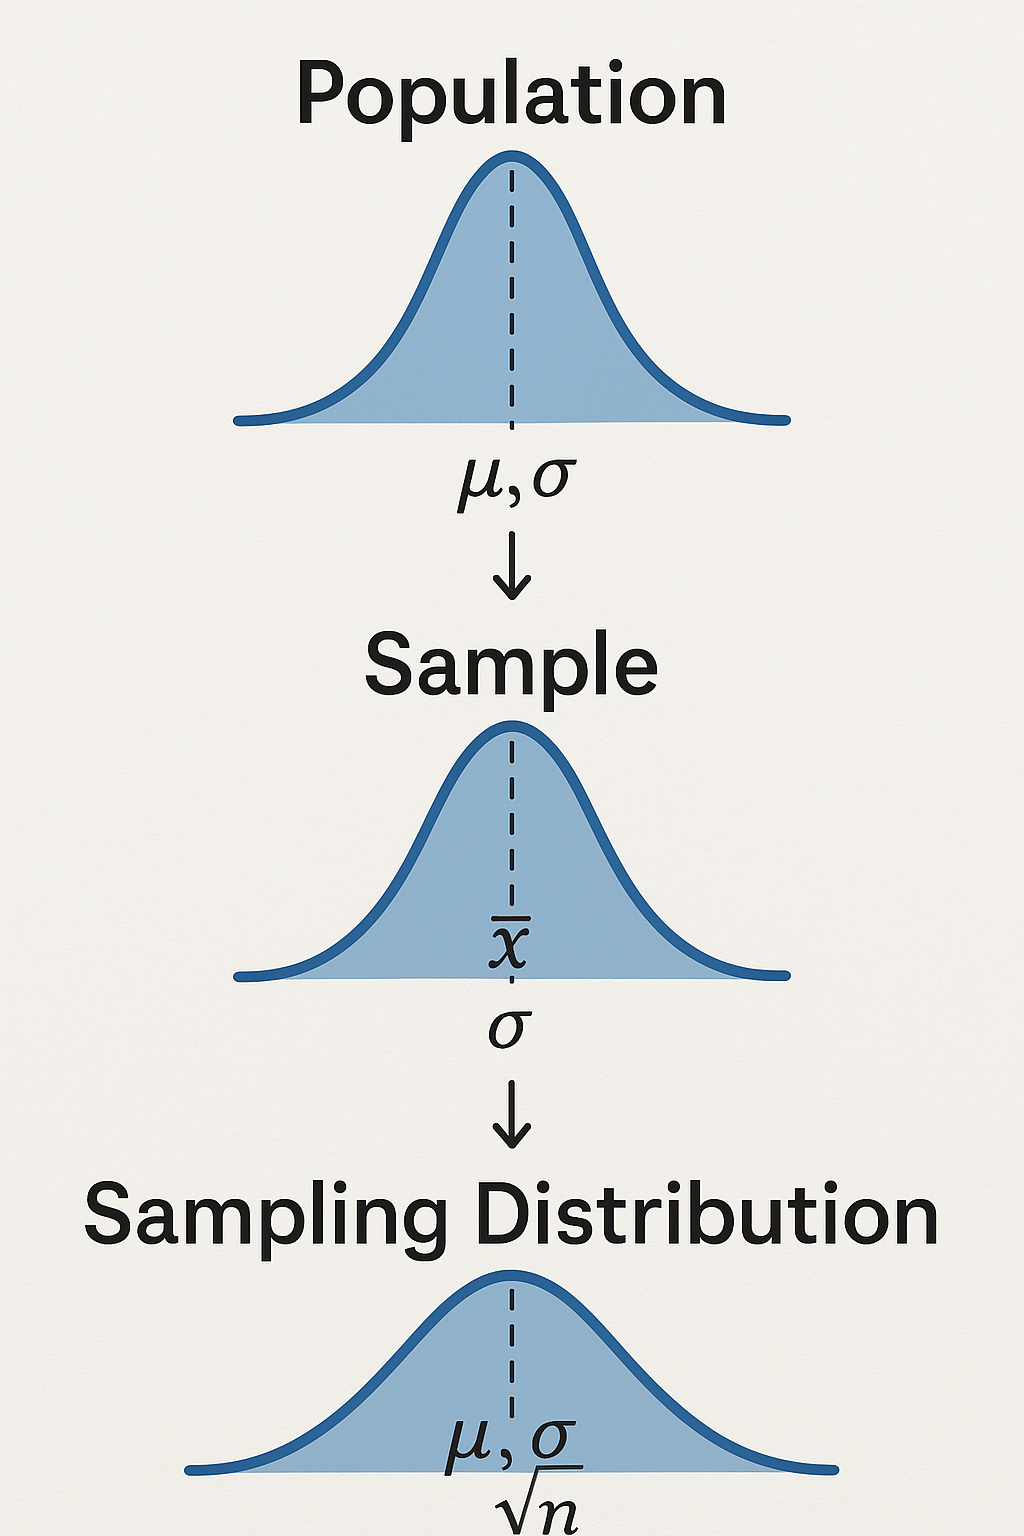
🎯 Population Distribution
The population distribution describes the values of a variable for all members of a population.
- Mean: \( \mu \) (population mean)
- Standard deviation: \( \sigma \) (population standard deviation)
Example:
Suppose the heights of all adults in a town are normally distributed with:
\[ \mu = 170 \text{ cm}, \quad \sigma = 10 \text{ cm} \]
To find the probability that a randomly selected adult is taller than 180 cm, convert the score to a Z-score:
\[ Z = \frac{180 - 170}{10} = 1 \]
Then look up \( P(Z > 1) \) in the standard normal table (approximately 0.1587).
🔍 Sample Distribution
The sample distribution is the distribution of observed data values in a particular sample.
- Mean: \( \bar{x} \) (sample mean)
- Standard deviation: \( s \) (sample standard deviation)
Example:
In a sample of 30 adults, you measure their heights and calculate:
\[ \bar{x} = 168 \text{ cm}, \quad s = 11 \text{ cm} \]
To find the probability a randomly selected person in this sample is shorter than 160 cm:
\[ Z = \frac{160 - 168}{11} \approx -0.73 \]
Look up \( P(Z < -0.73) \) in the Z-table (about 0.2327).
📊 Sampling Distribution of the Sample Mean
The sampling distribution of the sample mean is a theoretical distribution of all possible sample means from samples of size \( n \).
- Mean of sampling distribution: \( \mu_{\bar{x}} = \mu \)
- Standard error: \( \sigma_{\bar{x}} = \frac{\sigma}{\sqrt{n}} \)
Important:
- It is always approximately normal, regardless of the population distribution (by CLT).
- We standardize using Z-scores to calculate probabilities about sample means.
Example:
From the previous population:
\[ \mu = 170, \quad \sigma = 10, \quad n=25 \]
The standard error is:
\[ \sigma_{\bar{x}} = \frac{10}{\sqrt{25}} = 2 \]
To find the probability that the sample mean is greater than 174 cm:
\[ Z = \frac{174 - 170}{2} = 2 \]
Look up \( P(Z > 2) \) (about 0.0228).
🤖 Real-World ML Example: Sampling Distributions
In machine learning, when evaluating models with cross-validation, each test fold is effectively a sample. The distribution of performance metrics (like accuracy or F1-score) across these folds forms a sampling distribution. Understanding this helps in estimating confidence intervals and variance in model evaluation.
Another example: In A/B testing for user interface design, comparing average click-through rates from multiple samples helps assess significance. Thanks to the Central Limit Theorem, the sample mean follows a normal distribution, making inference possible.
🧠 Level Up: Deeper Insights into Sampling Distributions
- The Central Limit Theorem explains why sampling distributions tend to normality even when populations are skewed.
- Sampling distributions can be used to calculate confidence intervals and conduct hypothesis tests.
- Understanding the shape and variability of sampling distributions is critical for accurate statistical inference.
- Advanced techniques like bootstrapping allow estimation of sampling distributions without relying on CLT assumptions.
✅ Best Practices for Sampling Distributions
- Use random sampling to avoid bias and ensure generalizability.
- Ensure your sample size is sufficiently large — especially if applying the Central Limit Theorem.
- Always differentiate between population and sample metrics (e.g., μ vs. x̄, σ vs. s).
- Visualize sampling distributions using histograms or dot plots to detect skewness or anomalies.
- Use standard error to understand variability in sample means.
⚠️ Common Pitfalls
- ❌ Confusing the population distribution with the sampling distribution.
- ❌ Assuming a small sample will behave like the population — the Central Limit Theorem only holds with large samples.
- ❌ Forgetting that the standard error decreases as sample size increases (by the square root rule).
- ❌ Misusing Z-scores without verifying normality or sufficient sample size.
- ❌ Treating sample statistics as if they were exact — always report uncertainty!
📌 Try It Yourself: Population, Sample, and Sampling Distributions
Q1: What does the population distribution represent?
💡 Show Answer
- A) Distribution of sample means
- B) Distribution of all members in the population ✓
- C) Distribution of one sample
- D) Distribution of Z-scores
Q2: What is the sampling distribution of the sample mean?
💡 Show Answer
- A) Distribution of all population values
- B) Distribution of sample means from many samples ✓
- C) Distribution of individual sample values
- D) Distribution of sample variances
Q3: What does standardizing a score (to a Z-score) allow you to do?
💡 Show Answer
- A) Ignore the mean and standard deviation
- B) Convert values to a common scale for probability calculations ✓
- C) Change the shape of the distribution
- D) Find the median
Q4: According to the Central Limit Theorem, the sampling distribution of the sample mean is approximately:
💡 Show Answer
- A) Uniform
- B) Skewed
- C) Normal (bell-shaped) ✓
- D) Bimodal
Q5: How do you calculate the standard error of the sample mean?
💡 Show Answer
- A) \( \sigma \times \sqrt{n} \)
- B) \( \frac{\sigma}{n} \)
- C) \( \frac{\sigma}{\sqrt{n}} \) ✓
- D) \( \sqrt{\sigma \times n} \)
✅ Summary
| Concept | Description |
|---|---|
| Population Distribution | Distribution of all members in the population |
| Sample Distribution | Distribution of data in a single sample |
| Sampling Distribution | Theoretical distribution of sample means from many samples |
| Mean of Sampling Distribution | Equals the population mean \( \mu \) |
| Standard Error | \( \sigma_{\bar{x}} = \frac{\sigma}{\sqrt{n}} \), variability of sample means |
| Standardization (Z-score) | Converting values to standard normal scores for probability calculations |
🔜 Up Next
In the next post, we’ll cover The Sampling Distribution of the Sample Proportion — essential for working with categorical data and proportions.
Stay curious! 📈
📺 Explore the Channel

🎥 Hoda Osama AI
Learn statistics and machine learning concepts step by step with visuals and real examples.
💬 Got a Question?
Leave a comment or open an issue on GitHub — I love connecting with other learners and builders. 🔁