From Sample to Population: Basics of Sampling in Statistics
Learn the difference between population and sample, key sampling techniques, and how sampling impacts data science and machine learning accuracy.
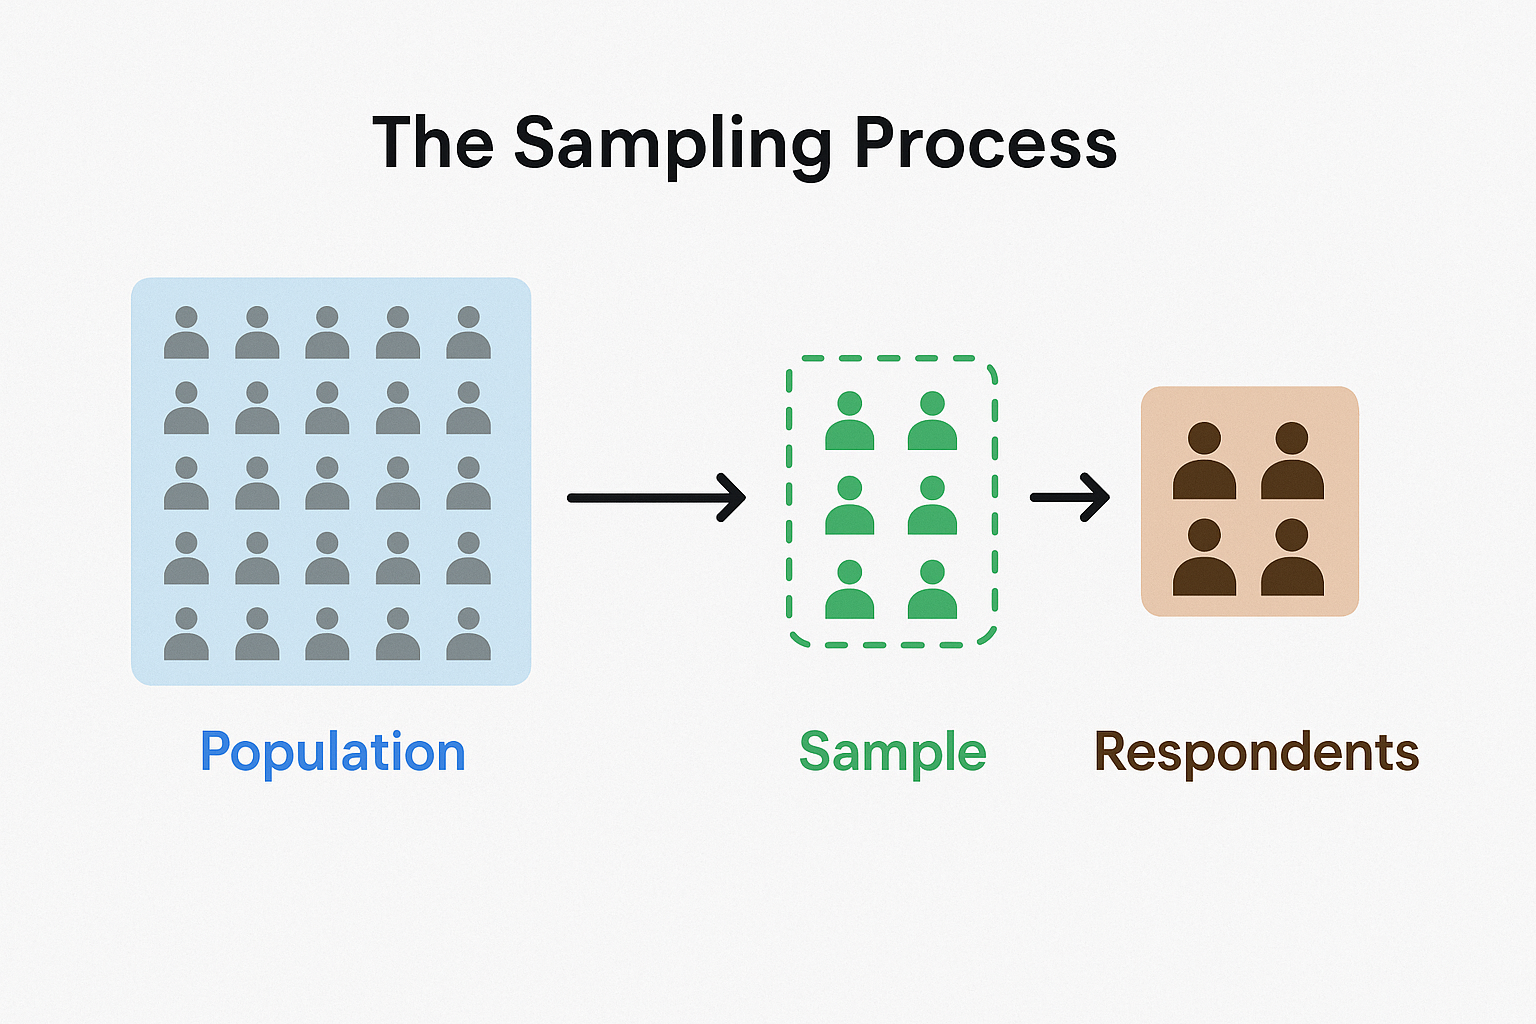
🎯 What’s the Difference Between a Population and a Sample?
Understanding the difference between a population and a sample is fundamental to mastering statistics and data analysis. A population includes every individual or observation of interest, while a sample is a representative subset used to make inferences.
Sampling lets you draw powerful conclusions without collecting data from everyone — a key principle behind both inferential statistics and machine learning.
📚 This post is part of the "Intro to Statistics" series
🔙 Previously: Understanding Binomial Distribution
🔜 Next: Understanding the Sampling Distribution of the Sample Mean and the Central Limit Theorem
🔍 Parameters vs. Statistics
When we study data:
- The characteristics of a population are called parameters — written using Greek letters (e.g., \( \mu \), \( \sigma \)).
- The characteristics of a sample are called statistics — written using Roman letters (e.g., \( \bar{x} \), \( s \)).
We use inferential statistics to predict population parameters from sample statistics.
🧪 The Importance of Simple Random Sampling
To make sure our sample fairly represents the population, we often use a Simple Random Sample (SRS).
In SRS:
- Every member of the population has an equal chance of being selected.
- This helps reduce bias and increases the accuracy of our predictions.
🧭 How to Take a Simple Random Sample
- Define your population.
- Create a sampling frame — a complete list of all cases.
- Use random methods (like a random number generator) to select your sample.
- Contact the selected respondents using:
- Face-to-face interviews
- Phone calls
- Online or paper questionnaires (easiest but less accurate)
⚠️ Common Sampling Errors and Biases
Even with careful planning, things can go wrong:
- Undercoverage Bias: Not all classes or groups are included in the sampling frame.
- Sampling Bias: For example, choosing a convenient sample (only nearby people).
- Non-response Bias: Selected individuals don’t respond.
- Response Bias: People give inaccurate answers (on purpose or by mistake).
🎯 Making a truly random sample is not easy, especially with real-world constraints.
🧰 Other Sampling Techniques
When Simple Random Sampling is too difficult, we use other methods:
1. Stratified Random Sampling
- The population is divided into groups (strata).
- A random sample is taken from each stratum.
- Works best when strata are clearly defined and understood.
2. Multistage Cluster Sampling
- Useful when there is no complete sampling frame.
- Select groups (clusters) randomly, then sample within them.
✅ In both techniques, knowing the population structure (strata or clusters) is key.
📡 Relevance to Machine Learning
Understanding sampling is critical for:
- Model training: Most ML models are trained on a sample (training set), not the full population.
- Avoiding bias: Biased sampling can lead to models that don’t generalize well.
- Cross-validation: Techniques like k-fold cross-validation depend on fair random samples.
- Data imbalance: Knowing how to sample different classes correctly can improve classification performance.
💡 Whether you’re balancing a dataset, evaluating a model, or testing generalization — sampling is at the heart of fair ML workflows.
📏 Bigger Is Better… But Randomness Matters
- A larger sample reduces random error.
- But if it’s not random, the results can still be misleading.
🎯 Randomness beats size if you must choose.
🧠 Level Up: Real-World Sampling Challenges
- Sampling frames may be outdated or incomplete — especially in population surveys.
- People may opt out of participation, especially in phone or online surveys.
- Oversampling certain strata is a valid strategy when some groups are small but important.
- Weighting responses after collection can help adjust for biases — but requires expertise.
✅ Best Practices in Sampling
- Define your population clearly before sampling.
- Prefer Simple Random Sampling when feasible — it minimizes bias.
- Use stratified sampling when subgroups vary significantly.
- Keep sampling frames up to date to avoid undercoverage.
⚠️ Common Pitfalls
- ❌ Using convenience samples — these rarely generalize well.
- ❌ Ignoring non-response bias in surveys.
- ❌ Overgeneralizing from a small or biased sample.
- ❌ Confusing sample statistics with population parameters without inference.
📌 Try It Yourself: Sampling Basics
Q1: Which of the following best describes a parameter?
💡 Show Answer
✅ B) A value that describes a population
A parameter is a fixed value that summarizes some aspect of the population (like the true mean or proportion).
Q2: What is the main reason for using a sample?
💡 Show Answer
✅ A) To save cost and effort
Collecting data from an entire population is often impractical, so we sample to gain insights efficiently.
Q3: What makes Simple Random Sampling "random"?
💡 Show Answer
✅ B) Every individual has an equal chance
This ensures fairness and reduces selection bias.
Q4: Which bias happens when certain groups are not in the sampling frame?
💡 Show Answer
✅ C) Undercoverage bias
This happens when the sampling frame misses part of the population (e.g., only landline users in a mobile world).
Q5: Which sampling method works best when strata are known?
💡 Show Answer
✅ B) Stratified random sampling
Stratified sampling divides the population into known groups (strata) and samples within each group.
✅ Summary
| Concept | Description |
|---|---|
| Population | The entire group you’re interested in |
| Sample | A subset selected from the population |
| Parameters | Characteristics of population (\( \mu, \sigma \)) |
| Statistics | Characteristics of sample (\( \bar{x}, s \)) |
| SRS | Simple Random Sample: equal chance selection |
| Bias Types | Undercoverage, Sampling, Non-response, Response |
| Other Techniques | Stratified, Cluster sampling |
🔜 Up Next
In the next post, we’ll explore the Sampling Distribution of the Sample Mean — how sample averages behave, the Central Limit Theorem, and why these concepts form the foundation of many statistical procedures
Stay curious! 📊
📺 Explore the Channel

🎥 Hoda Osama AI
Learn statistics and machine learning concepts step by step with visuals and real examples.
💬 Got a Question?
Leave a comment or open an issue on GitHub — I love connecting with other learners and builders. 🔁