Making Sense of Probabilities: Union, Tables, and Conditional Thinking
Learn how to calculate the probability of combined events using union rules, contingency tables, and conditional logic. This post walks you through marginal, joint, and conditional probabilities with intuitive visuals, real-world examples, and quiz-based learning.
When working with data, it’s critical to understand how probabilities interact — especially when events overlap or depend on one another. In this post, you’ll learn how to calculate unions, read contingency tables, and understand conditional probabilities using intuitive visuals and real-life examples.
📚 This post is part of the "Intro to Statistics" series
🔙 Previously:How Random Is Random? Understanding Probability and Events
🔜 Next: Understanding Bayez-Rule<
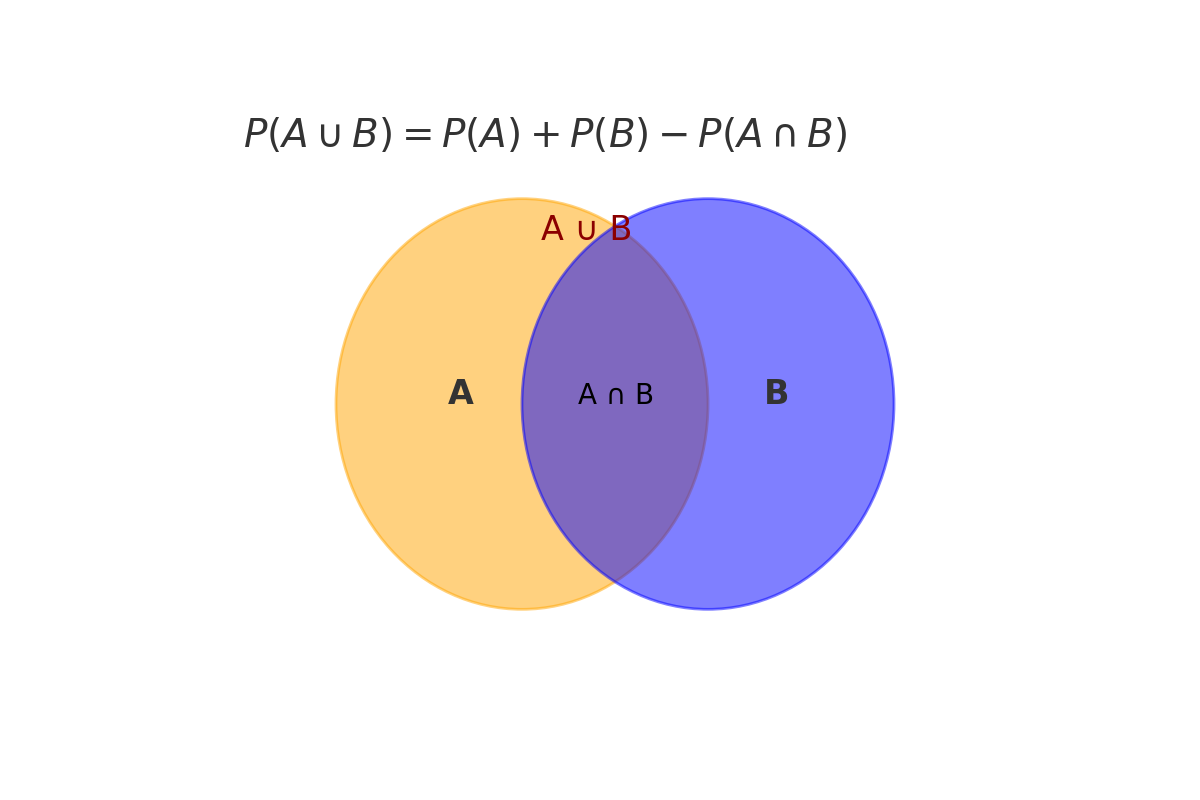
🔗 Union of Events: The Addition Rule
When calculating the probability of A or B, we combine the probabilities — but subtract any overlap:
\[ P(A \cup B) = P(A) + P(B) - P(A \cap B) \]
This is called the Addition Rule.
✅ Special Case: Disjoint Events
If A and B are mutually exclusive (disjoint), then \( P(A \cap B) = 0 \), so:
\[ P(A \cup B) = P(A) + P(B) \]
📊 Visual Aid Placeholder
📊 Marginal and Joint Proportions with Tables
Let’s say we ask 100 people whether they own a dog or a cat:
| Owns Dog | No Dog | Total | |
|---|---|---|---|
| Owns Cat | 20 | 30 | 50 |
| No Cat | 25 | 25 | 50 |
| Total | 45 | 55 | 100 |
🧩 What Are Margins?
- The totals in the last row and column are called marginal totals.
- Their proportions (divided by total) are marginal proportions:
- Example: \( P(\text{Owns Dog}) = 45 / 100 = 0.45 \)
🔄 Joint Probability Table
To convert to probabilities, divide each cell by total:
| Owns Dog (D) | No Dog | Total | |
|---|---|---|---|
| Owns Cat (C) | 0.20 | 0.30 | 0.50 |
| No Cat | 0.25 | 0.25 | 0.50 |
| Total | 0.45 | 0.55 | 1.00 |
These are joint probabilities (each cell shows \( P(C \cap D) \), etc).
✅ Total of each row/column = 1
✅ This set of events is jointly exhaustive
💡 You can compute marginal probabilities by summing across rows or columns.
⚠️ But you can’t always reverse this — joint probability can’t be recovered from marginal alone.
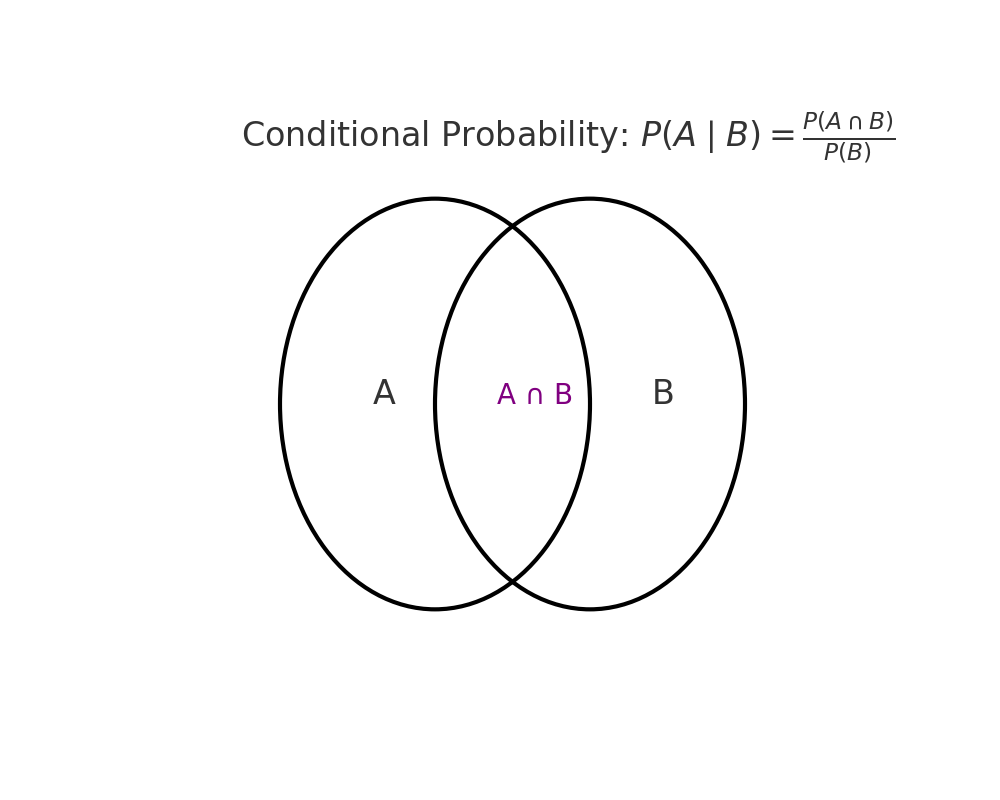
📌 Conditional Probability: What If We Know B Happened?
Conditional probability is:
\[ P(A \mid B) = \frac{P(A \cap B)}{P(B)} \]
Read as “the probability of A given B.”
📊 Venn Diagram Placeholder
🧪 Problem 1 — Using the Table
Q: What’s the probability that a person owns a cat given they own a dog?
\[ P(\text{Cat} \mid \text{Dog}) = \frac{P(\text{Cat and Dog})}{P(\text{Dog})} = \frac{0.20}{0.45} \approx 0.444 \]
🧪 Problem 2 — Medical Testing Example
| Disease (+) | No Disease (−) | Total | |
|---|---|---|---|
| Test + | 40 | 10 | 50 |
| Test − | 10 | 40 | 50 |
| Total | 50 | 50 | 100 |
Let’s convert to probabilities:
\[ P(\text{Disease} \mid \text{Test +}) = \frac{40}{50} = 0.8 \]
🧠 The test is positive, and there’s an 80% chance the person actually has the disease.
🤖 Why This Matters to Machine Learning
Understanding probability rules is foundational to many ML algorithms:
- Naive Bayes classifiers rely on conditional probability.
- Confusion matrices and precision/recall relate to joint and marginal probabilities.
- Probabilistic reasoning underlies Bayesian networks, Hidden Markov Models, and likelihood estimation.
By mastering unions, intersections, and conditional logic, you’re building the intuition needed for more complex ML reasoning.
📌 Try It Yourself: Union & Conditional Thinking
Q1: If events A and B are disjoint, what is P(A ∪ B)?
💡 Show Answer
P(A ∪ B) = P(A) + P(B) — because disjoint events can’t happen together, so there’s no overlap to subtract.
Q2: In a contingency table, how do you calculate a joint probability?
💡 Show Answer
Divide the frequency in a single cell by the total sample size. P(A ∩ B) = count in cell / grand total
Q3: What are marginal probabilities and where do you find them?
💡 Show Answer
They’re totals across rows or columns in a table, divided by the grand total.
They show the overall probability of a single variable.
Q4: What’s the formula for conditional probability?
💡 Show Answer
P(A | B) = P(A ∩ B) / P(B) — it’s the probability of A given B has occurred.
Q5: Why can’t marginal probabilities alone determine joint probabilities?
💡 Show Answer
Because they don’t show how two variables interact — they only describe each variable separately.
You need joint or conditional data to understand overlap.
Q6: You know that 90% of cat owners like coffee. What kind of probability is that?
💡 Show Answer
It’s a conditional probability: the chance of liking coffee given that someone owns a cat.
🧠 Level Up: Know When to Use Conditional Probabilities
Conditional probability isn’t just for math exams — it powers real-world decisions:
- 🩺 In medical testing, it tells us the chance a patient actually has a condition, given a positive test.
- 📈 In finance, it helps estimate risks based on market behavior.
- 🧠 In machine learning, it's the backbone of models like Naive Bayes and Bayesian networks.
Mastering it helps you move from counting events to thinking conditionally — just like algorithms do.
✅ Best Practices for Probability Thinking
- Use **Venn diagrams** or tables to clarify overlap and independence.
- Double-check whether events are **mutually exclusive** or **independent** — they’re not the same!
- Normalize tables to probabilities for clearer analysis.
- Label everything clearly: A, B, A ∩ B, A ∪ B, etc.
⚠️ Common Pitfalls
- ❌ Assuming disjoint events are independent.
- ❌ Forgetting to subtract the intersection in union calculations.
- ❌ Using marginal totals to infer conditional relationships directly.
🧠 Summary
| Concept | Meaning |
|---|---|
| Union of A and B | Add both, subtract intersection |
| Disjoint events | No overlap: \( P(A \cup B) = P(A) + P(B) \) |
| Marginal proportion | Total rows/columns ÷ total cases |
| Joint probability | Cell ÷ total |
| Conditional \( P(A \mid B) \) | Probability of A given B |
✅ Up Next
We’ll now explore probability rules in depth, including:
- Complement rules
- Bayes’ Theorem
- Advanced conditional reasoning
See you there!
📺 Explore the Channel

🎥 Hoda Osama AI
Learn statistics and machine learning concepts step by step with visuals and real examples.
💬 Got a Question?
Leave a comment or open an issue on GitHub — I love connecting with other learners and builders. 🔁