Measuring Variability: Variance and Standard Deviation
Learn how variance and standard deviation measure the spread of your data — with formulas, worked examples, and relevance to data science and machine learning.
The mean tells you where the center of your data is — but not how far the values spread out around that center. That’s where variance and standard deviation come in. These two key measures of variability help you understand data spread, identify outliers, and support better machine learning decisions.
📚 This post is part of the "Intro to Statistics" series
🔙 Previously: Understanding Dispersion: Range, IQR, and the Box Plot
🎯 Why Use Variance and Standard Deviation?
Let’s say you and your friend both scored an average of 75 in two different classes.
But in your class, scores ranged from 70 to 80, while in theirs, they ranged from 30 to 120.
Clearly, the data behaves very differently despite the same average.
That’s where variance and standard deviation help:
- They show how spread out the data is from the mean
- And they use every single value to calculate that spread
📐 Variance Formula
The variance tells us how far each value is from the mean, on average — but in squared units.
\[ \sigma^2 = \frac{1}{N} \sum_{i=1}^{N} (x_i - \bar{x})^2 \]
Where:
- \( x_i \) = each individual value
- \( \bar{x} \) = mean of all values
- \( N \) = total number of values
👉 This formula squares each deviation from the mean so that positive and negative differences don’t cancel out.
📊 Population vs sample variance
In theory, the formula above describes the population variance, using the true population mean \( \mu \) and the population size \( N \):
\[ \sigma^2 = \frac{1}{N} \sum_{i=1}^{N} (x_i - \mu)^2 \]
In practice, we usually work with a sample of size \( n \). We estimate variance with the sample mean \( \bar{x} \) and divide by \( n - 1 \):
\[ s^2 = \frac{1}{n - 1} \sum_{i=1}^{n} (x_i - \bar{x})^2 \]
- \( \mu, \sigma^2 \): population mean and population variance
- \( \bar{x}, s^2 \): sample mean and sample variance
In the example below, the sum of squared deviations is 66.
- Dividing by \( 5 \) gives the population variance \( 66 / 5 = 13.2 \).
- Dividing by \( 5 - 1 \) gives the sample variance \( 66 / 4 = 16.5 \).
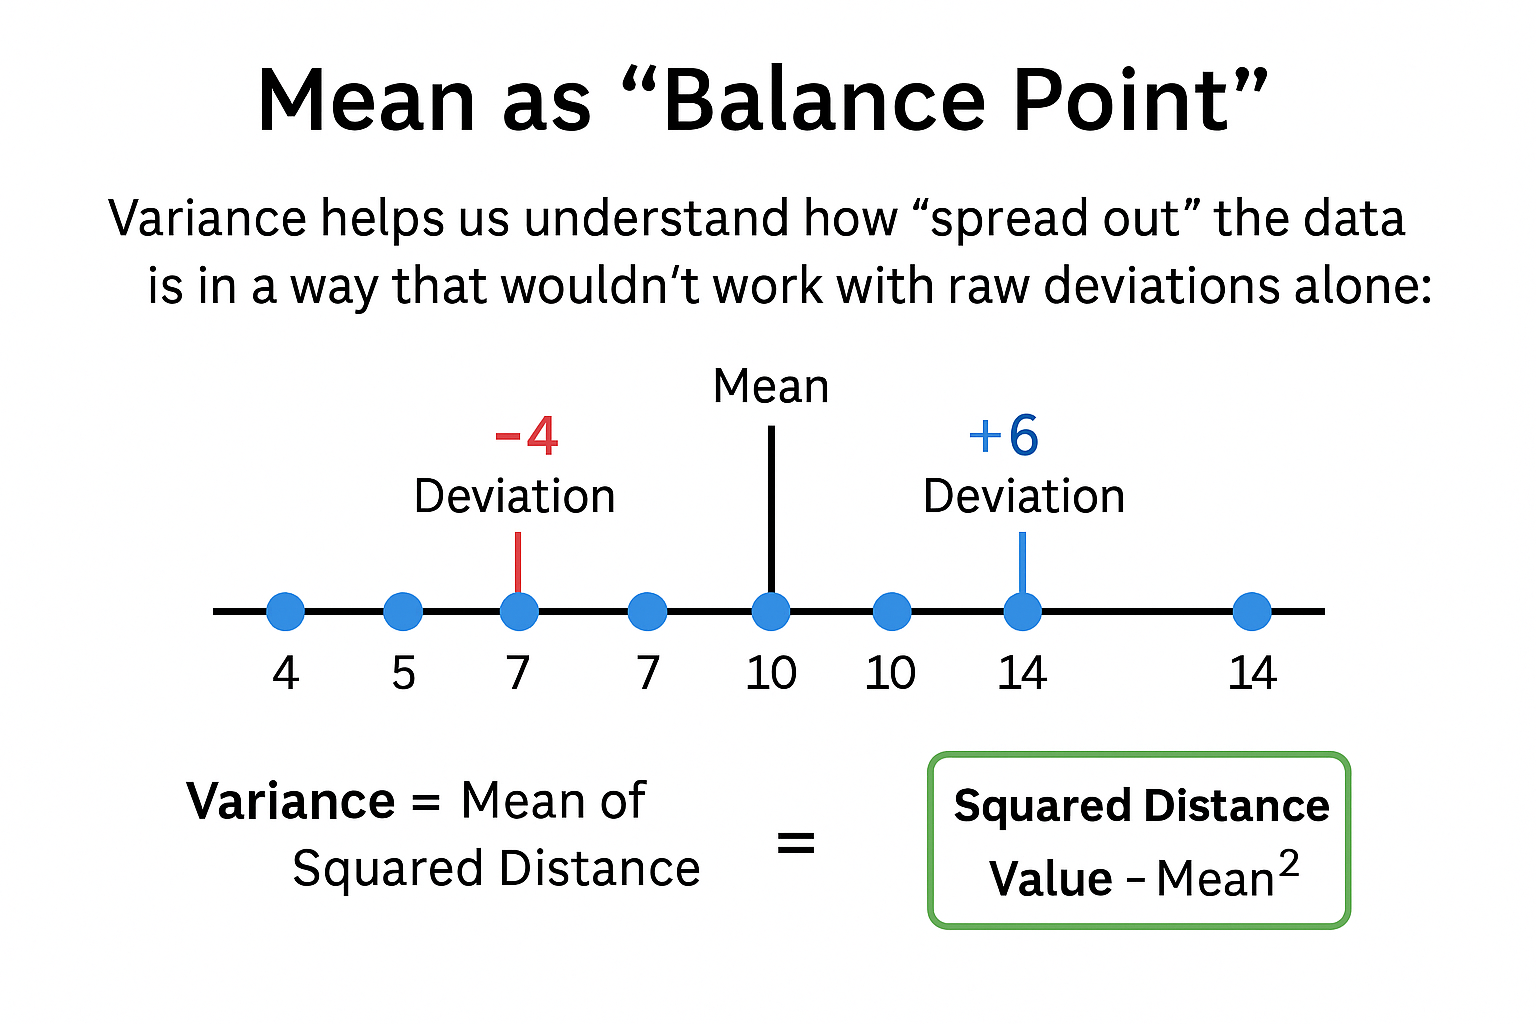
🧮 Why Not Use Raw Deviations?
You might wonder:
“Why not just find the average of the differences from the mean?”
Because:
\[ \sum (x_i - \bar{x}) = 0 \]
The values above the mean exactly cancel out those below the mean.
So we square each deviation before averaging them — that gives us the variance.
📊 Step-by-Step Variance Example
Let’s say we have these 5 values:
[4, 5, 7, 10, 14]
First compute the mean:
\[ \bar{x} = \frac{4 + 5 + 7 + 10 + 14}{5} = 8 \]
Now build the table:
| x | \(\bar{x}\) | x - \(\bar{x}\) | (x - \(\bar{x}\))² |
|---|---|---|---|
| 4 | 8 | -4 | 16 |
| 5 | 8 | -3 | 9 |
| 7 | 8 | -1 | 1 |
| 10 | 8 | 2 | 4 |
| 14 | 8 | 6 | 36 |
The sum of squared deviations is:
\[ 16 + 9 + 1 + 4 + 36 = 66 \]
- Mean (\( \bar{x} \)) = (4 + 5 + 7 + 10 + 14) / 5 = 8
- Variance = 66 / 5 = 13.2
So the average squared distance from the mean is 13.2
1
2
3
4
5
6
7
8
9
10
11
import numpy as np

data = [4, 5, 7, 10, 14]

# Variance
variance = np.var(data)
print("Variance:", variance)

# Standard Deviation
std_dev = np.std(data)
print("Standard Deviation:", std_dev)
Note: This calculates population variance and std. dev. If you want sample versions, use ddof=1
🧠 But What Does It Mean?
A higher variance = more spread
A lower variance = more consistency
But here’s the problem:
🛑 Variance is in squared units (like meters² or dollars²). That’s hard to interpret.
📏 Standard Deviation
To fix that, we take the square root of the variance.
This gives us the standard deviation, which is:
\[ \sigma = \sqrt{\sigma^2} \]
From our example:
\[ \sqrt{13.2} \approx 3.63 \]
So the average distance from the mean is about 3.63 units — in the same units as the original data.
📌 In most statistical studies, standard deviation is the preferred measure of variability.
🖼️ Visual Insight: Same Mean, Different Spread
Two datasets can have the same mean but behave very differently.
| Dataset A | Dataset B |
|---|---|
| [7, 8, 8, 9, 8] | [2, 5, 8, 11, 14] |
| Mean = 8 | Mean = 8 |
| Low spread (tight) | High spread (wide) |
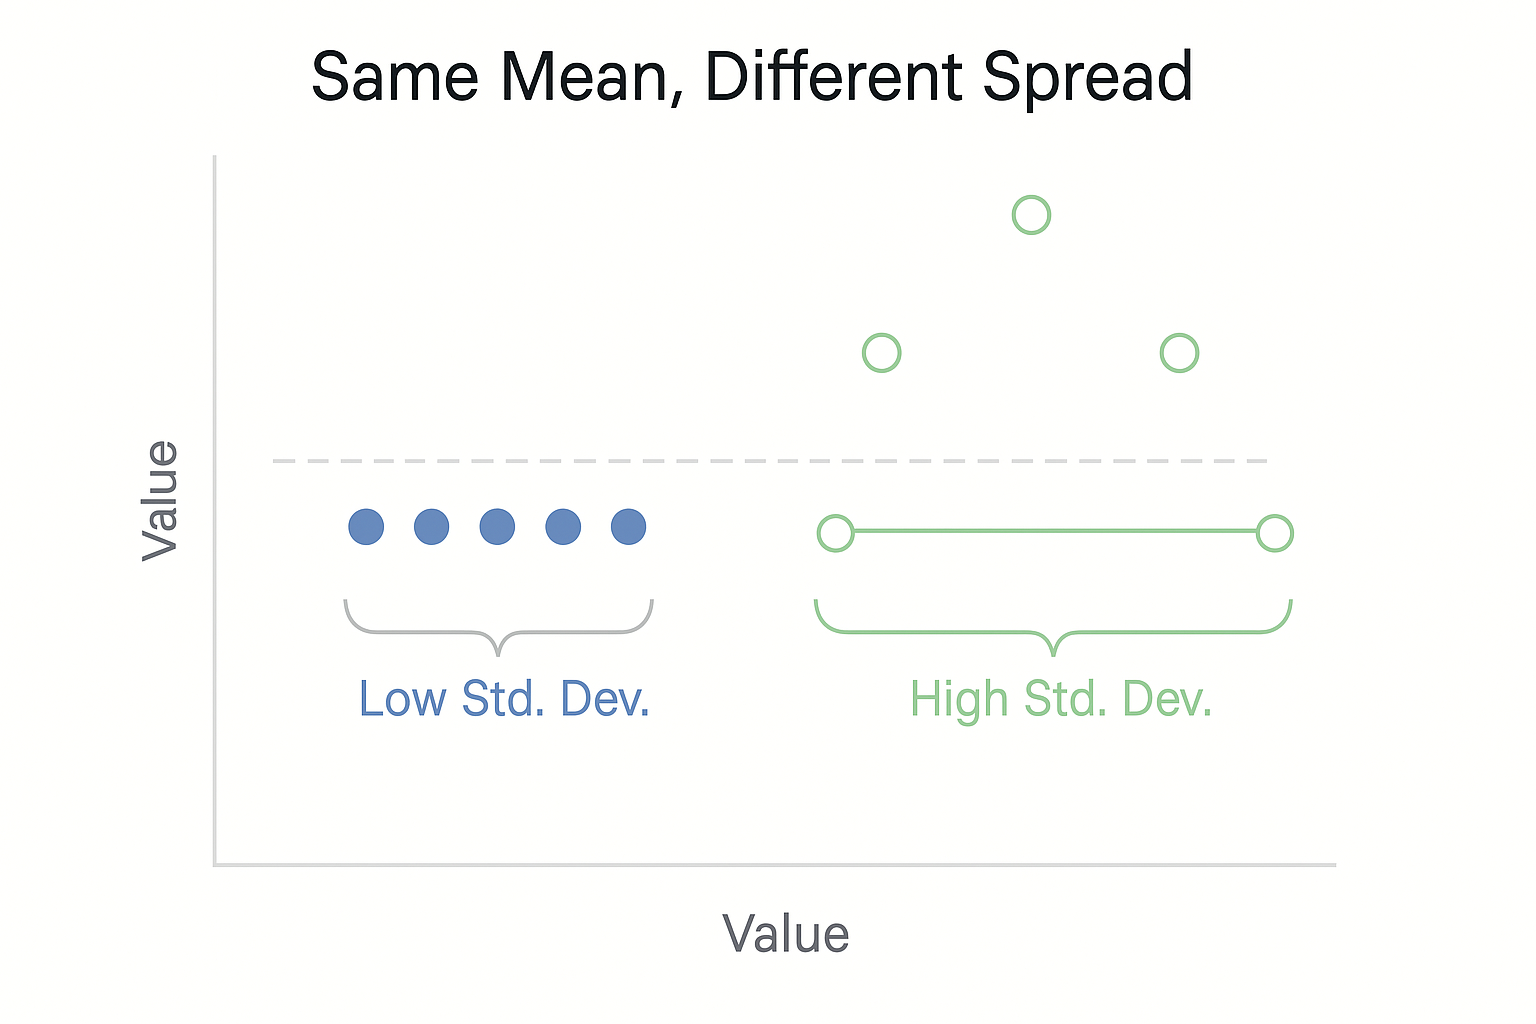
✅ Standard deviation and variance help quantify this spread — telling us how consistent or variable the data really is.
🖼️ Visual: Squared Deviations Around the Mean
📊 Comparison of Spread Measures
| Method | Uses All Data? | Affected by Outliers? | Units? |
|---|---|---|---|
| Range | ❌ No | ✅ Yes | Same as data |
| IQR | ❌ No | ❌ No | Same as data |
| Variance | ✅ Yes | ✅ Yes | Squared units |
| Standard Deviation | ✅ Yes | ✅ Yes | Same as data |
✅ Best practices for variance and standard deviation
- Always look at the context. Interpret variance and standard deviation together with the mean and the units of the data, not in isolation.
- Check for outliers first. Strong outliers can inflate variance and standard deviation, so inspect the data before drawing conclusions.
- Distinguish population and sample. Use the population formulas when you have the full population and the sample formulas (divide by \(n - 1\)) when you estimate from a sample.
- Use standard deviation for interpretation. Variance is useful in formulas, but standard deviation is usually easier to interpret because it is in the same units as the original data.
- Combine with graphics. Support variance and standard deviation with plots such as histograms and boxplots to see the full shape of the distribution.
⚠️ Common pitfalls with variance and standard deviation
- Applying variance to categorical data. Avoid using variance or standard deviation for purely categorical variables where numeric codes do not represent real distances.
- Ignoring skewness and heavy tails. For highly skewed or heavy tailed data, a few extreme values can dominate variance and standard deviation, so always check the shape of the distribution.
- Assuming normality without checking. Treat rules like "within two standard deviations is typical" as approximate and use them only after confirming that the distribution is roughly symmetric and unimodal.
- Comparing spread without considering scale. A standard deviation value is large or small only relative to the units and the mean of the variable, so never interpret it without that context.
- Relying only on variance to judge features. High variance does not always mean a feature is informative and low variance does not always mean it is useless, so combine variance checks with domain knowledge and model performance.
🧠 Level Up: Why Variance and Standard Deviation Matter in Data Analysis
Variance and standard deviation are foundational concepts for understanding data variability. Here’s why they’re crucial:
- 📊 Variance measures the average squared deviation from the mean, providing a sense of overall spread.
- 📏 Standard deviation converts variance back into original units, making it more interpretable.
- 🎯 These measures allow you to quantify uncertainty, compare consistency across datasets, and detect outliers.
- 🤖 In machine learning, many algorithms assume data has consistent variance (homoscedasticity), making these measures critical.
Grasping variance and standard deviation sets the stage for more advanced statistical techniques and modeling.
🤖 Why variance and standard deviation matter in Machine Learning
Variance and standard deviation are not only statistics concepts. They appear everywhere in machine learning.
1. Loss functions and error metrics
Many core metrics in ML are based on squared deviations:
- Mean Squared Error (MSE) measures the average of squared differences between predictions and true values.
- Root Mean Squared Error (RMSE) is the square root of MSE and is directly comparable to a standard deviation.
Both MSE and RMSE play a similar role to variance and standard deviation. They describe how spread out prediction errors are around zero.
2. Model stability and noise
A high variance in the target variable can indicate:
- Data that is naturally very spread out.
- Strong noise that may limit how well any model can perform.
Looking at the variance and standard deviation of the target before modeling helps you understand if a certain error level is realistic or not.
3. Feature variability and usefulness
For input features:
- Features with almost zero variance are nearly constant and often add very little information to the model.
- Features with very high variance may dominate distance based algorithms or indicate strong noise.
Checking feature variances is a simple way to:
- Remove near constant features.
- Detect suspicious or badly scaled features before training.
4. Outliers and data quality
Values that lie several standard deviations away from the mean are potential outliers.
In a machine learning workflow, variance and standard deviation help you:
- Flag unusual data points that may be errors.
- Decide when to investigate, transform, or cap extreme values before training.
- Prepare the ground for using Z scores and other standardized measures in later steps of the pipeline.
💡 Bottom line: Variance and standard deviation aren’t just mathematical tools — they influence how your model sees, processes, and learns from data.
📌 Try It Yourself
Q: Two classes take the same math quiz. The average score in both classes is 75.
In Class A, most students score between 70 and 80. In Class B, scores range widely — from 40 to 100.
Which class has a higher standard deviation, and what does that tell us?
💡 Show Answer
✅ Class B — because its scores are much more spread out from the mean.
A higher standard deviation means the scores are less consistent and show greater variability.
Bonus: What’s the key difference between variance and standard deviation?
💡 Show Answer
✅ Variance is the average of squared differences from the mean.
Standard deviation is the square root of variance — it brings the result back to the original unit, making it easier to interpret.
🔎 Remember
- Variance and standard deviation are highly sensitive to extreme outliers.
- For very skewed or heavy tailed data, also look at robust measures such as the median and interquartile range (IQR).
- Do not use variance or standard deviation for purely categorical variables where numeric distances do not make sense.
🔁 Summary
| Measure | What it Tells Us | Notes |
|---|---|---|
| Variance | Spread based on squared deviations | Good for math, hard to interpret |
| Standard Deviation | Avg. distance from mean (√variance) | Easy to interpret, widely used |
✅ Up Next
In the next post, we’ll explore the Z-score — a tool to standardize any value and compare it across datasets with different means and spreads.
Stay curious!
📺 Explore the Channel

🎥 Hoda Osama AI
Learn statistics and machine learning concepts step by step with visuals and real examples.
💬 Got a Question?
Leave a comment or open an issue on GitHub — I love connecting with other learners and builders. 🔁